


Grade Level: 9-12
Students analyze four data visualizations focused on the topic of sea level. They use a jigsaw method to explore and communicate their findings to their peers.
Since 1880, the global sea level has risen 8 inches; by 2100, it is projected to rise another 1 to 4 feet. Two characteristics of climate change are resulting in sea level rise. First, the melting of ice sheets and glaciers on land are adding more water to the oceans. Second, ocean temperatures are increasing, leading to ocean thermal expansion. For more than 20 years, NASA has been tracking the global surface topography of the ocean to understand the important role it plays in our daily lives. A suite of increasingly sophisticated instruments, deployed across the oceans, on polar ice, and in orbit, reveal significant changes among globally interlocking factors that are driving sea levels higher.


Students analyze four data visualizations focused on the topic of sea level. They use a jigsaw method to explore and communicate their findings to their peers.

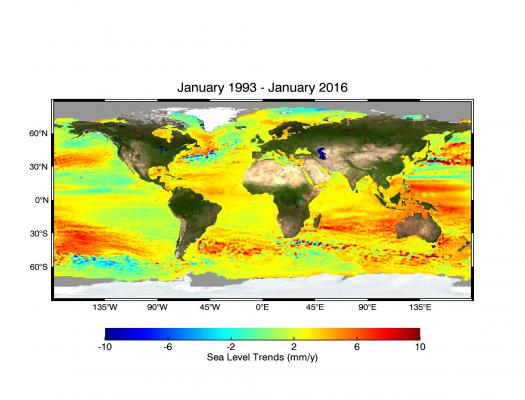
Students analyze the stability and change of sea level after watching a visualization of sea level height around the world.
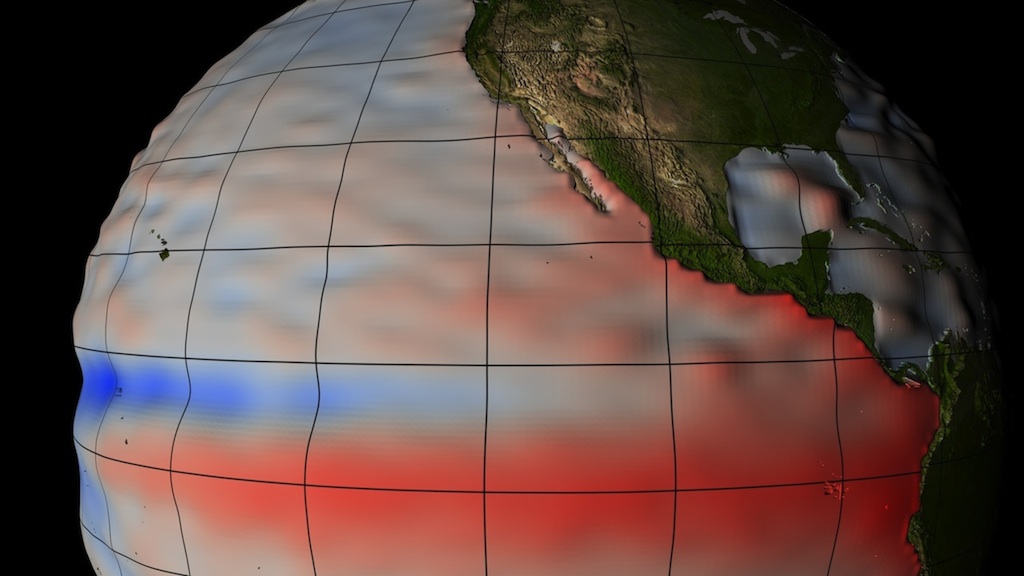
For over 20 years, satellite instruments have measured the sea surface height of our ever-changing oceans. This video of images shows the complicated patterns of rising and falling ocean levels across the globe from 1993 to 2015.

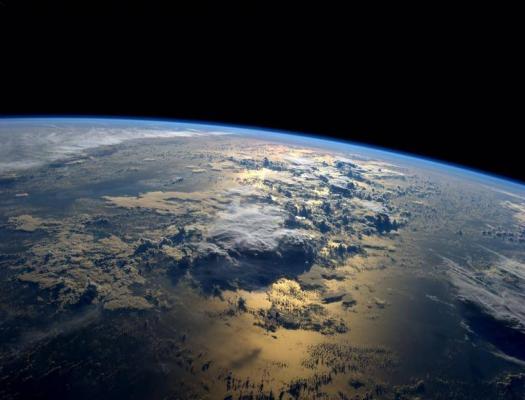
Students examine the two time series images to determine the differences between seasonal ice melt over water versus land.
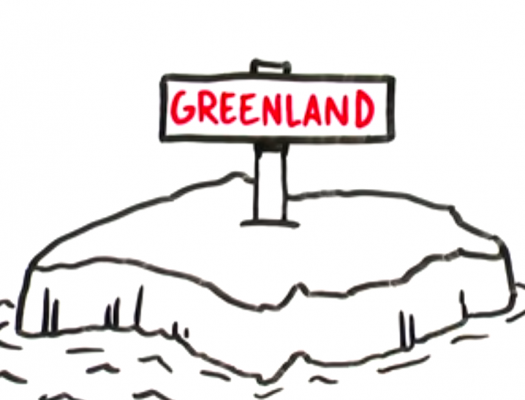
Students will watch a video on the Greenland Ice Sheet and answer questions.
Students analyze four data visualizations focused on the topic of sea level. They use a jigsaw method to explore and communicate their findings to their peers.
Students analyze the stability and change of sea level after watching a visualization of sea level height around the world.

For over 20 years, satellite instruments have measured the sea surface height of our ever-changing oceans. This video of images shows the complicated patterns of rising and falling ocean levels across the globe from 1993 to 2015.
Students examine the two time series images to determine the differences between seasonal ice melt over water versus land.

Students will watch a video on the Greenland Ice Sheet and answer questions.