Grade Level: 6-8
This mini lesson engages students in writing a commentary for a NASA video regarding changes in global temperatures from 1880 to 2017.
The world's surface air temperature is getting warmer. Whether the cause is human activity or natural changes in the Earth System—and the enormous body of evidence says it’s humans—thermometer readings all around the world have risen steadily since the beginning of the Industrial Revolution.


This mini lesson engages students in writing a commentary for a NASA video regarding changes in global temperatures from 1880 to 2017.


Students analyze a graph that illustrates the change in global surface temperature relative to 1951-1980 average temperatures.


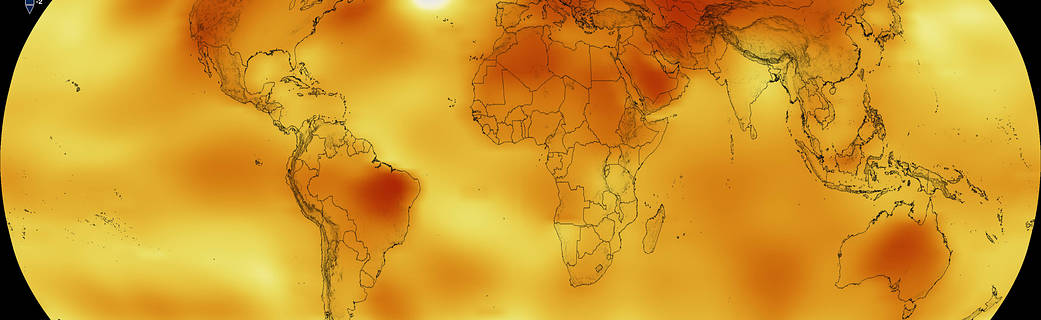
Students analyze surface air temperature anomalies to identify change with respect to different latitudes across the world.

Students observe the map image, individually, looking for changes in surface air temperatures (using data displayed, unit of measure, range of values, etc.) and noticeable patterns.
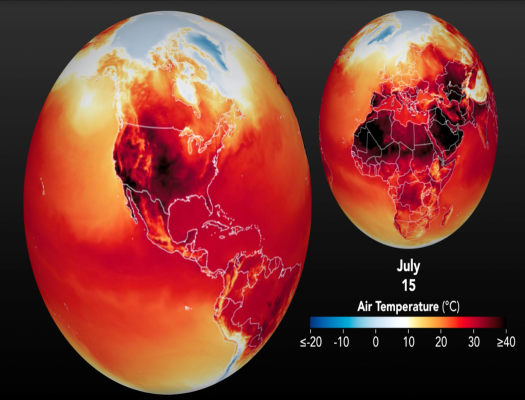
By investigating the data presented in a model that displays extreme summer air temperatures, students explain energy transfer in the Earth system and consider the impact of excessive heat on local communities.
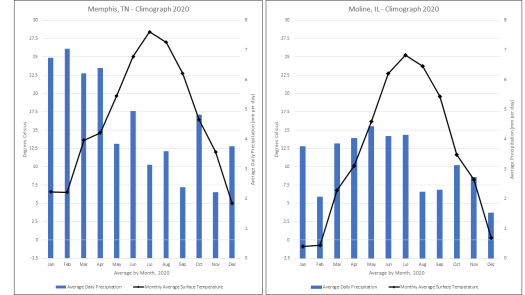
Students compare climographs for two locations to determine the most likely months to expect the emergence of mosquitoes in each location.

This mini lesson focuses on the 2015-2016 El Niño event and how its weather conditions triggered regional disease outbreaks throughout the world. Students will review a NASA article and watch the associated video to use as a tool to compare with maps related to 2015-2016 rainfall and elevated disease risk, and answer the questions.
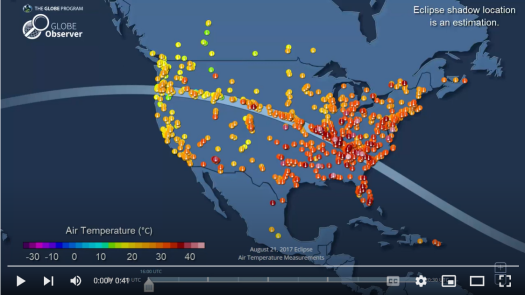
Students will examine air temperature data collected through The GLOBE Program during the 2017 US solar eclipse.
This mini lesson engages students in writing a commentary for a NASA video regarding changes in global temperatures from 1880 to 2017.
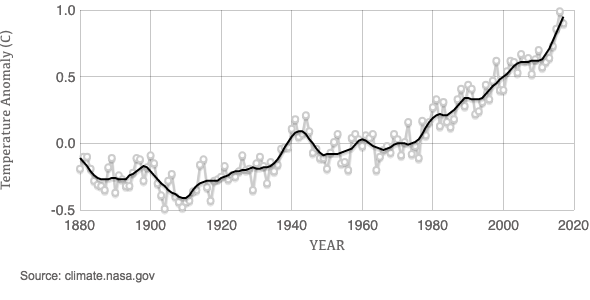
Students analyze a graph that illustrates the change in global surface temperature relative to 1951-1980 average temperatures.
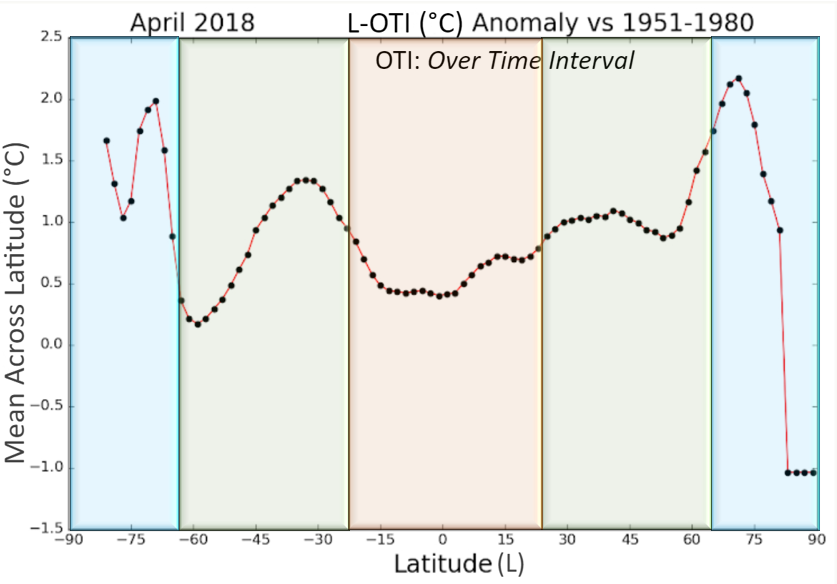
Students analyze surface air temperature anomalies to identify change with respect to different latitudes across the world.
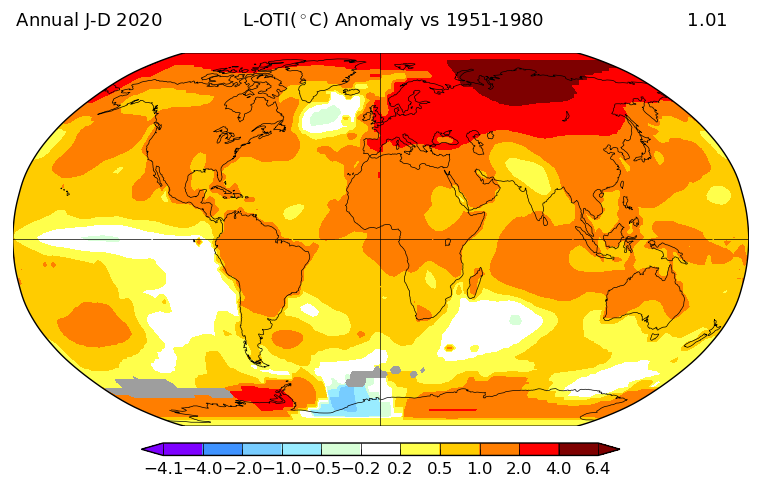
Students observe the map image, individually, looking for changes in surface air temperatures (using data displayed, unit of measure, range of values, etc.) and noticeable patterns.
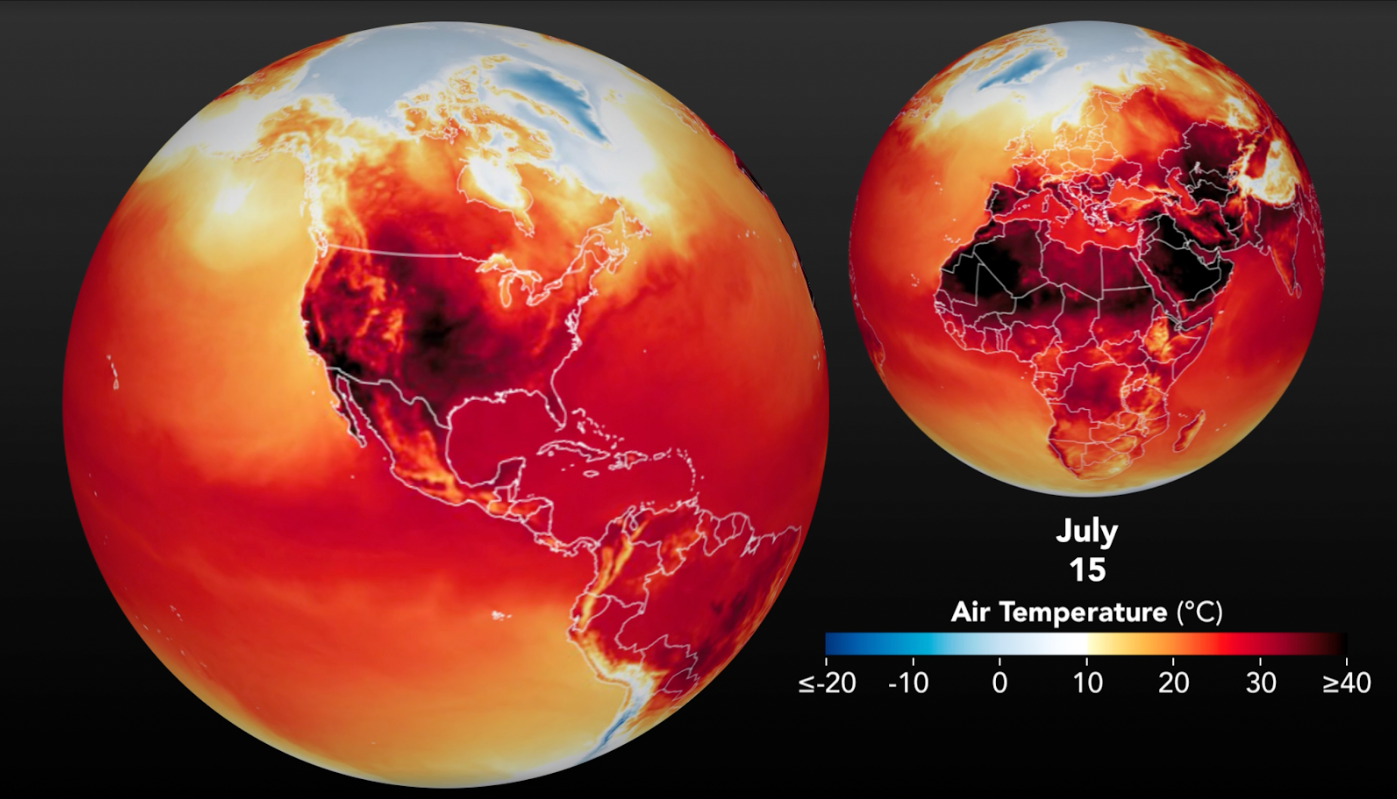
By investigating the data presented in a model that displays extreme summer air temperatures, students explain energy transfer in the Earth system and consider the impact of excessive heat on local communities.

Students compare climographs for two locations to determine the most likely months to expect the emergence of mosquitoes in each location.
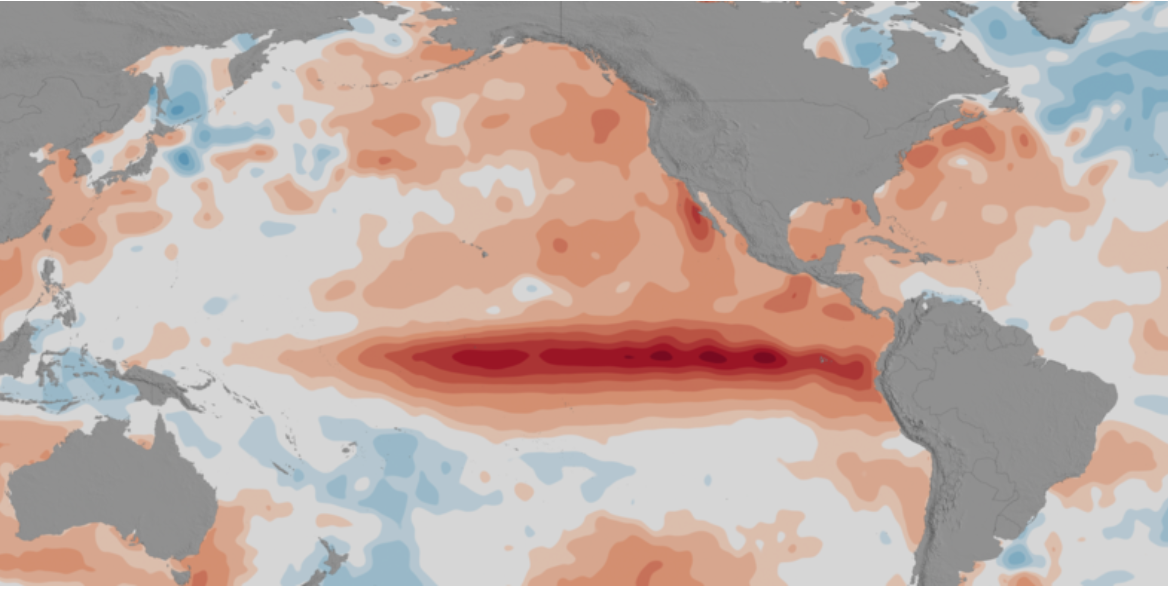
This mini lesson focuses on the 2015-2016 El Niño event and how its weather conditions triggered regional disease outbreaks throughout the world. Students will review a NASA article and watch the associated video to use as a tool to compare with maps related to 2

Students will examine air temperature data collected through The GLOBE Program during the 2017 US solar eclipse.

