
Grade Level: 6-8,
9-12
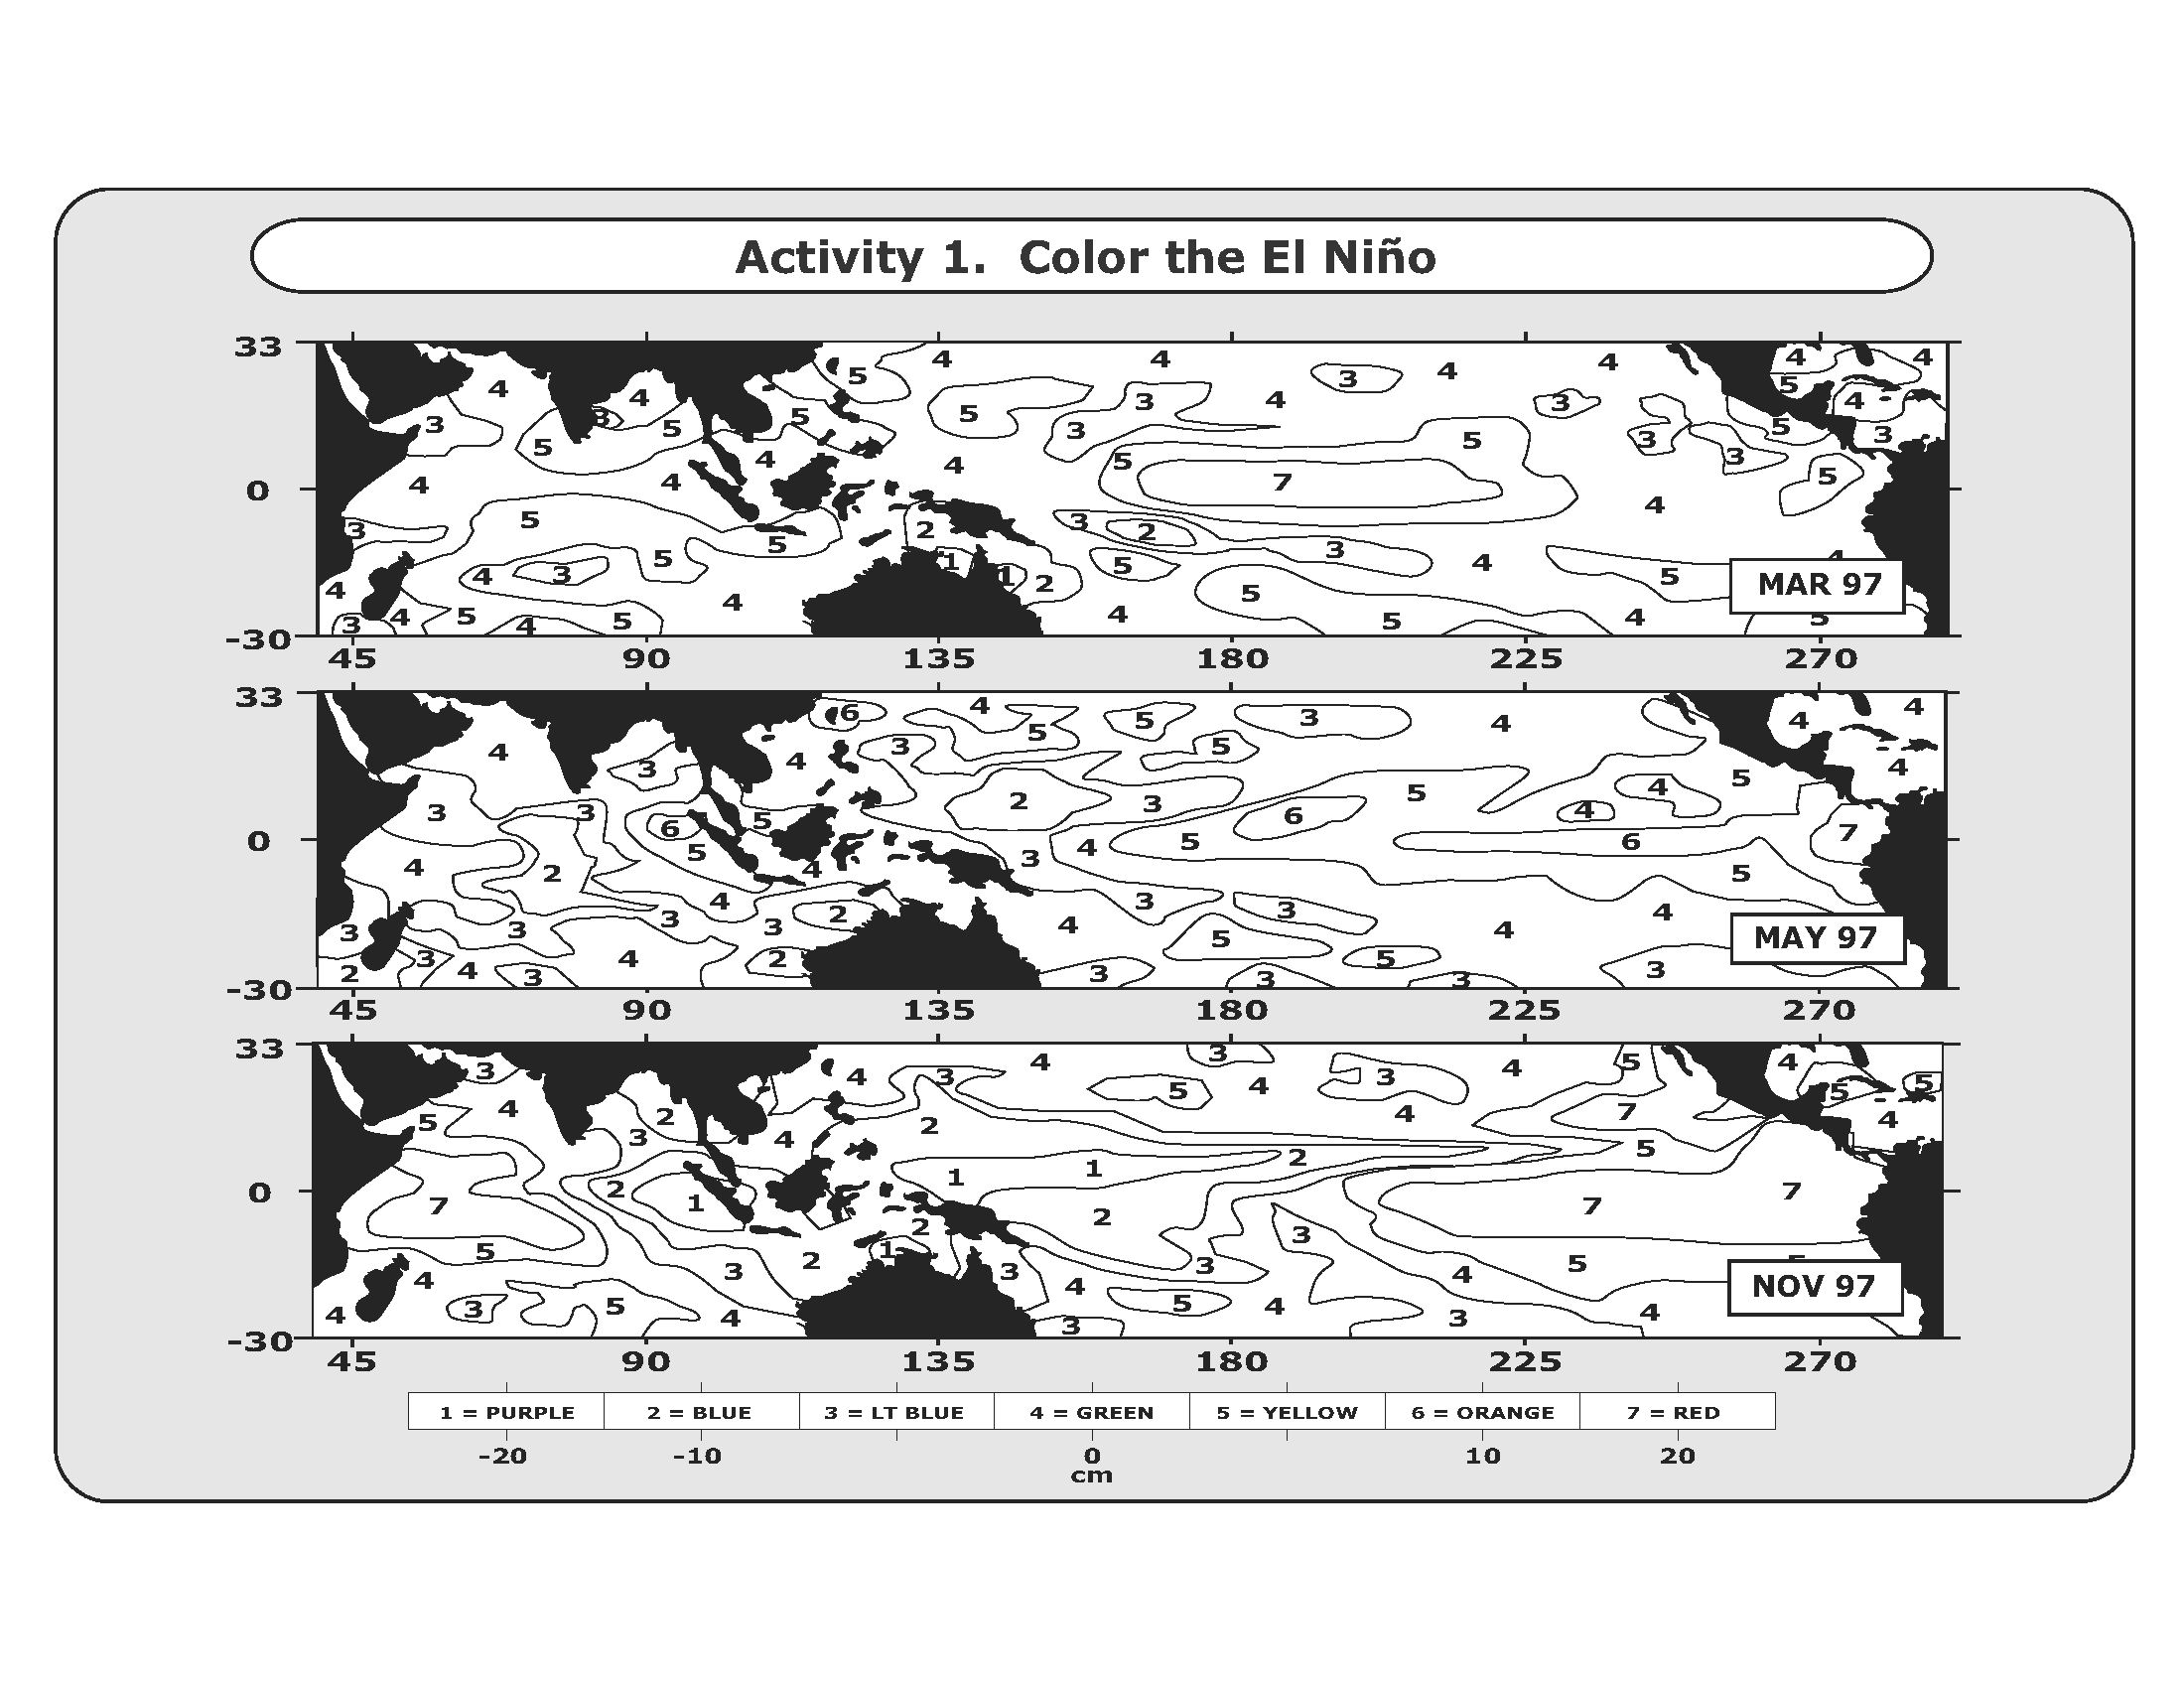
Students will use coloring sheets to create a color coded model of El Niño, then make comparisons using the actual model by answering questions. If the Data Literacy Map Cube is used with this, students will color their models first.