GLOBE Connections
GLOBE Protocol Bundle: Rivers and Lakes
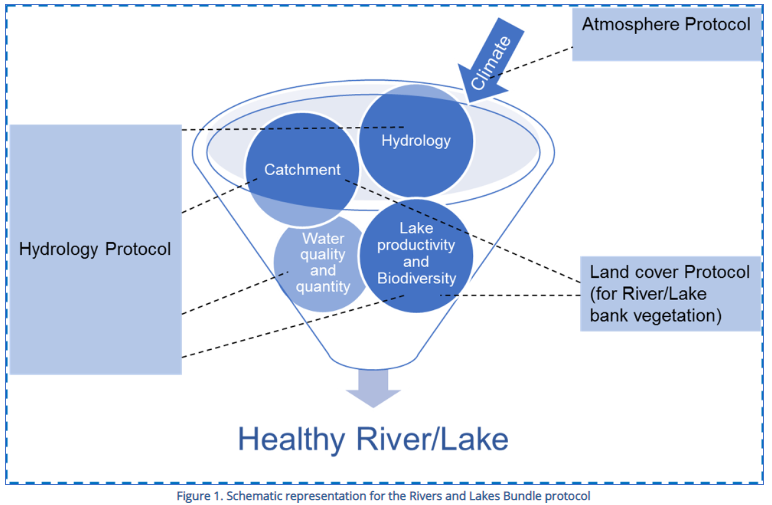
Rivers and Lakes
Rivers and lakes supply water for drinking, irrigation, manufacturing, energy and transport. They also help to prevent erosion, provide natural protection from flooding, moderate the local climate, and act as sink for the waste we dispose in rivers and lakes. (Source: GLOBE Rivers and Lakes Protocol Bundle)
The GLOBE database provides data submitted by individuals for specific protocols which can be used in investigations. In addition, there are additional data available in the My NASA Data Earth System Data Explorer. These data can provide context and background information or provide data for additional locations. There are also data for additional parameters not included in GLOBE.
When investigating rivers and lakes, there are many interrelated variables that can be explored through the Earth System Data Explorer. Some of these are directly related to a GLOBE protocol which is part of the protocol bundle. Others are indirectly related. The data sets below have been identified as those that can complement these investigations. The specific GLOBE protocols used in the bundle can be found in the section below the related Earth System Data Explorer data sets section.
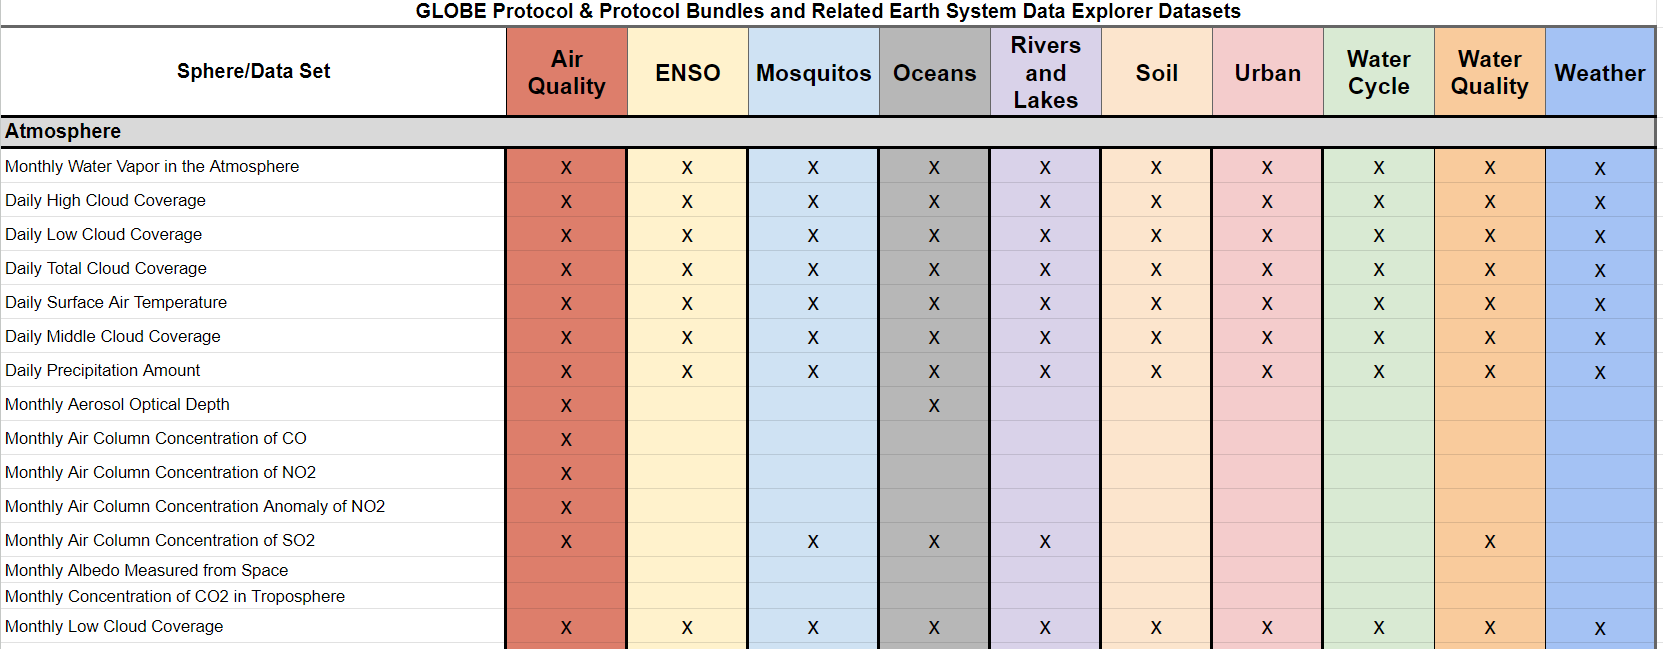
Related Earth System Data Explorer data sets:
Explore the MND GLOBE Connections Datasets spreadsheet to review the range of datasets available to integrate with GLOBE Protocol Bundle research by visiting the link.
Dataset Recommendations and Rationale:
Air temperature and surface temperature are related to many things including water bodies. These temperature data sets allow students to explore daily and monthly temperature averages including over water. They can also research monthly surface air temperature and air temperature anomalies to help put their own data in context. Finally, surface temperatures are also available.
- Daily Surface Air Temperature
- Monthly Surface Air Temperature
- Monthly Surface Air Temperature Anomaly
- Monthly Daytime Surface (Skin) Temperature
- Monthly Nighttime Surface (Skin) Temperature
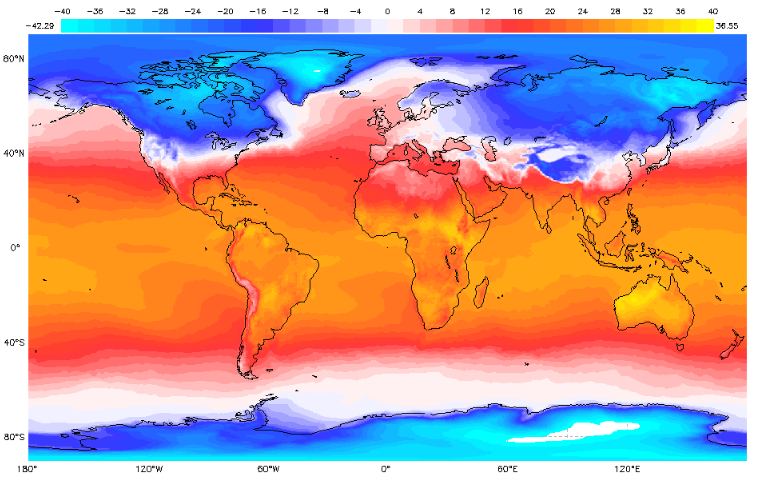
Monthly Surface Air Temperature - February 2019
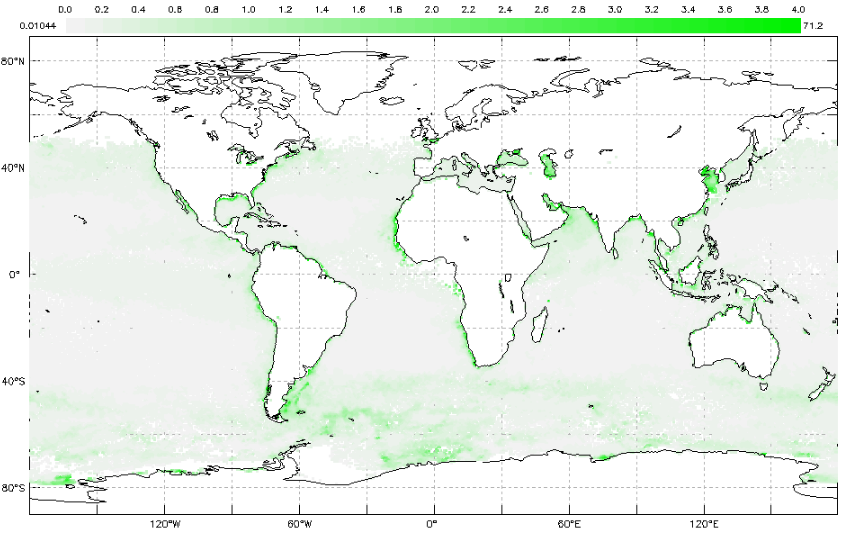
Dissolved oxygen in water, nitrates and water transparency are impacted by chlorophyll levels.
- Monthly Chlorophyll Concentration
Precipitation is related to rivers and lakes as they can be sources of clouds or precipitation can enter these water bodies. These data are complemented by cloud data and water vapor data.
- Daily High Cloud Coverage
- Daily Low Cloud Coverage
- Daily Mean Relative Humidity
- Daily Middle Cloud Coverage
- Daily Total Cloud Coverage
- Monthly Low Cloud Coverage
- Monthly Total Cloud Coverage
- Monthly Water Vapor in the Atmosphere
- Daily Precipitation Amount
- Monthly Average Precipitation Rate
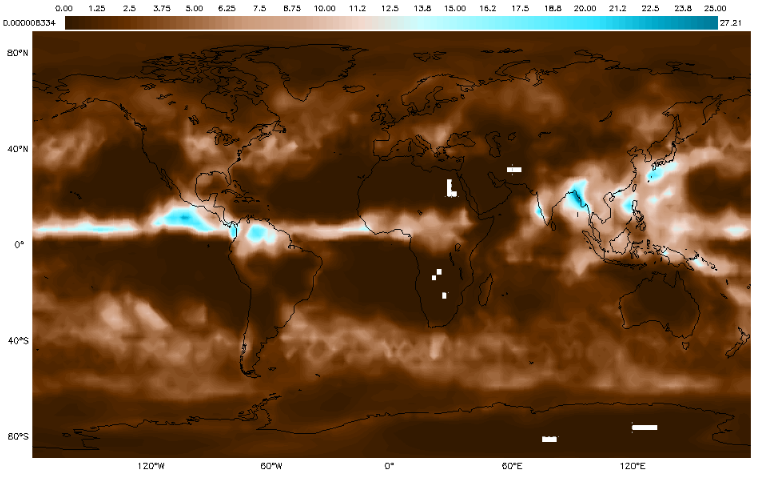
Monthly Precipitation - June 2018
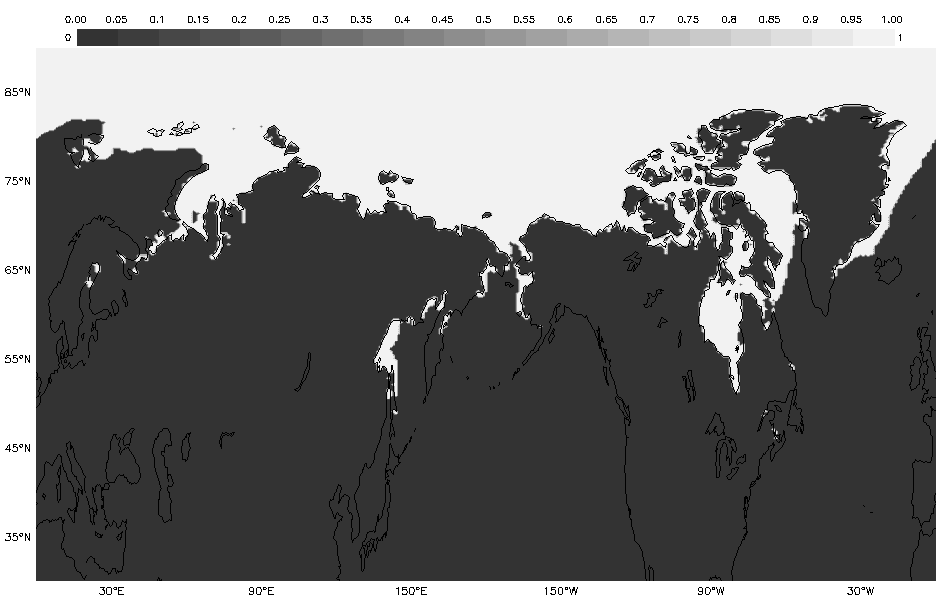
Salinity of salty or brackish water is part of the protocol bundle. Sea ice melt can impact the salinity of the ocean or brackish waters near oceans. These data show the monthly average sea ice extent across the Northern Hemisphere. The areas in white are where ice is at least partially covering the ocean surface (at least 15% coverage). The formation of sea ice greatly increases the salinity and density of the water at remaining at the surface of the ocean.
- Monthly Sea Ice Extent (Northern Hemisphere)
- Monthly Sea Surface Salinity
GLOBE Protocols Include:
- Atmosphere
- Air Temperature - Measure the current air temperature when an instrument shelter is not available. Current air temperature is measured using a thermometer held in the open air but in the shade for at least 3 minutes.
- Precipitation (including pH) - To determine the amount of moisture input to the local environment by measuring rain and snowfall and to measure the pH of precipitation.
- Relative Humidity - Students measure the relative humidity using either a digital hygrometer or a sling psychrometer.
- Biosphere
- Land Cover Classification - Students locate, photograph, and determine the MUC class for 90 m x 90 m areas of homogeneous land cover.
- Hydrosphere
- Alkalinity - Students will measure the alkalinity of water using an alkalinity test kit.
- Conductivity - Students will measure the electrical conductivity of water at freshwater hydrology sites.
- Dissolved Oxygen - Students will measure dissolved oxygen in the water at their site using a dissolved oxygen test kit or probe.
- Nitrates - Students will measure the nitrate/nitrogen content of water using a nitrate test kit.
- pH - Students will measure the pH of the water using either pH paper or a pH meter.
- Salinity (Including Titration) - Students will measure the salinity of a salty or brackish water sample using a hydrometer and thermometer.
- Water Temperature - Students will measure the temperature of the water.
- Water Transparency - Students will first measure water transparency at their undisturbed study site using a transparency tube or Secchi disk.