GLOBE Connections
GLOBE Protocol Bundle: Water Quality
Water Quality
Water quality in general cannot be measured using remote sensing, so the data that GLOBE scientists, teachers, and students collect are vital and help us to become better informed and engaged stewards for the water in our environment. By taking measurements following the protocols in this bundle the GLOBE community will learn about water in their local environment and can collaborate with others around the world. There is no end to what we can achieve through collaboration and cooperation! (Source: GLOBE Water Quality Bundle)
Related Earth System Data Explorer datasets:
Explore the MND GLOBE Connections Datasets spreadsheet to review the range of datasets available to integrate with GLOBE Protocol Bundle research by visiting the link.
Dataset Recommendations and Rationale:
Air temperature and surface data sets allow students to explore monthly temperature averages for air and Earth's surface. They can also investigate relationships between water temperature, air temperature and surface temperatures.
- Daily Surface Air Temperature
- Monthly Surface Air Temperature
- Monthly Surface Air Temperature Anomaly
- Monthly Daytime Surface (Skin) Temperature
- Monthly Nighttime Surface (Skin) Temperature
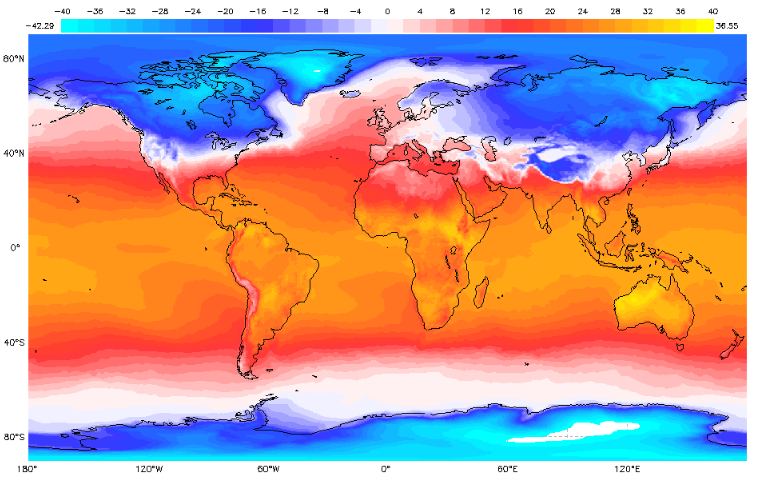
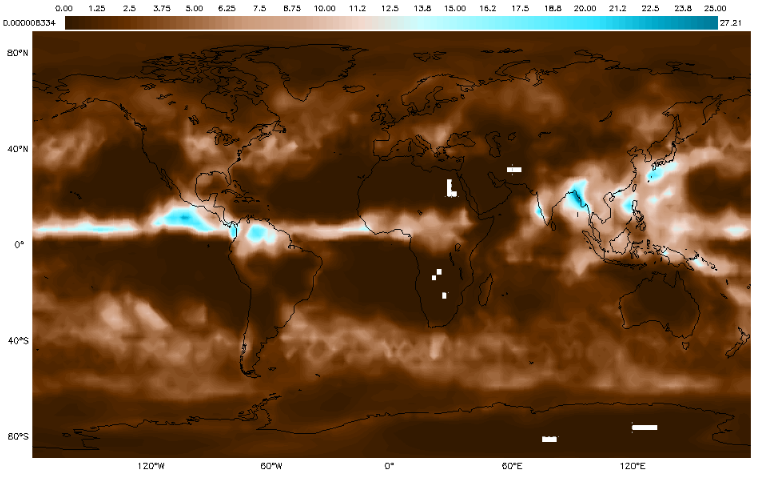
Monthly Surface Air Temperature - February 2019
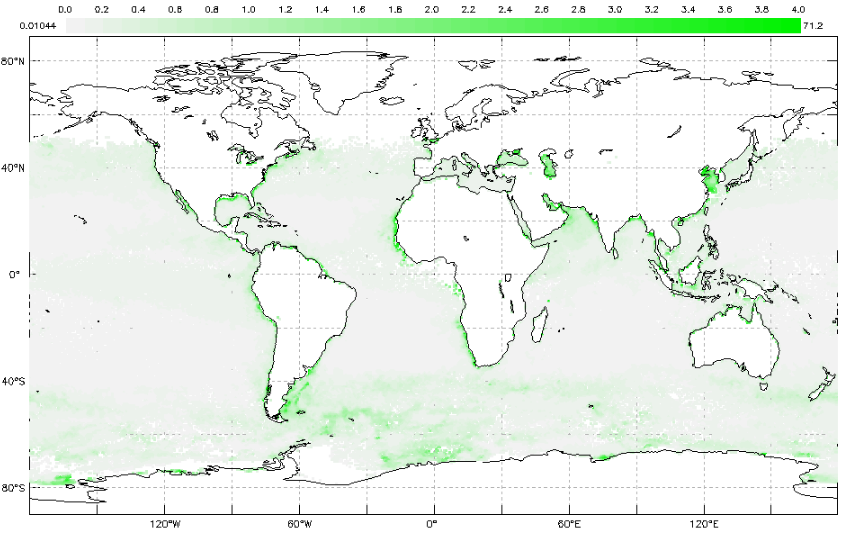
Dissolved oxygen, nitrates and transparency are related to chlorophyll levels.
- Monthly Chlorophyll Concentration
Precipitation can impact water quality. These data are complemented by cloud data and water vapor data.
- Daily High Cloud Coverage
- Daily Low Cloud Coverage
- Daily Middle Cloud Coverage
- Daily Total Cloud Coverage
- Monthly Low Cloud Coverage
- Monthly Total Cloud Coverage
- Monthly Water Vapor in the Atmosphere
- Daily Precipitation Amount
- Monthly Average Precipitation Rate
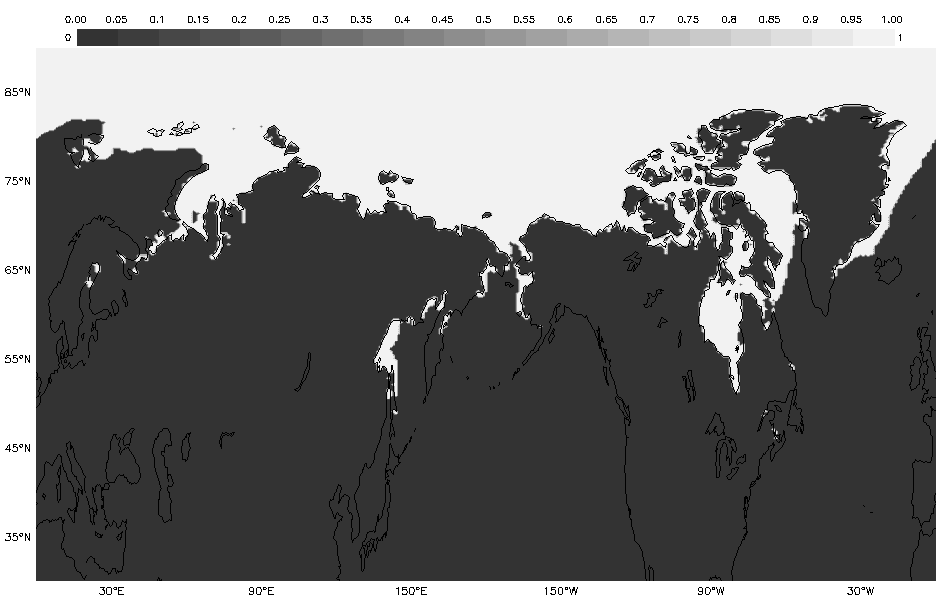
Salinity can be influenced by sea ice melt among other factors. These data show the monthly average sea ice extent across the Northern Hemisphere. The areas in white are where ice is at least partially covering the ocean surface (at least 15% coverage). The formation of sea ice greatly increases the salinity and density of the water at remaining at the surface of the ocean, causing the water to sink.
- Monthly Sea Ice Extent (Northern Hemisphere)
- Monthly Sea Surface Salinity
GLOBE Protocols Included:
- Atmosphere
- Precipitation (including pH) - To determine the amount of moisture input to the local environment by measuring rain and snowfall and to measure the pH of precipitation.
- Hydrosphere
- Alkalinity - Students will measure the alkalinity of water using an alkalinity test kit.
- Dissolved Oxygen - Students will measure dissolved oxygen in the water at their site using a dissolved oxygen test kit or probe.
- Nitrates - Students will measure the nitrate/nitrogen content of water using a nitrate test kit.
- pH - Students will measure the pH of the water using either pH paper or a pH meter.
- Salinity (Including Titration) - Students will measure the salinity of a salty or brackish water sample using a hydrometer and thermometer.
- Water Temperature - Students will measure the temperature of the water.
- Water Transparency - Students will first measure water transparency at their undisturbed study site using a transparency tube or Secchi disk.
- Pedoshpere (Geosphere)
- Soil pH - Students will prepare a one-to-one mixture of dry soil and distilled water and then measure the pH of the liquid left after most of the soil has settled to the bottom of the mixture.