GLOBE Connections
GLOBE Protocol Bundle: Oceans
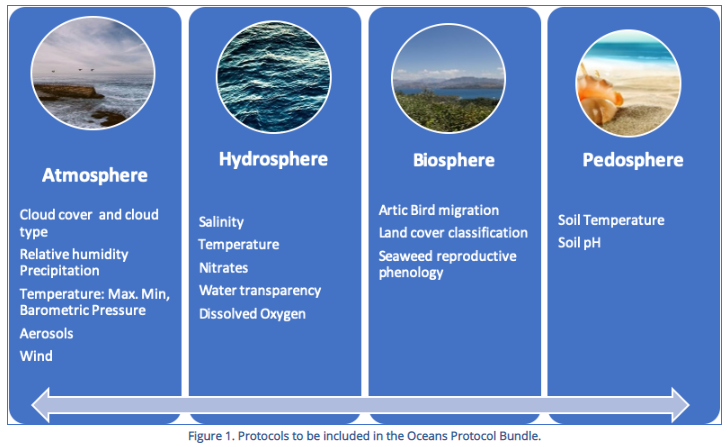
Oceans
Oceans are complex ecosystems, which implies that their study needs to take into consideration several interrelated physical parameters, not to mention the mechanisms and processes which reflect the interaction between land and oceans along coastal zones as well as the interaction between the atmosphere and oceans. (Source: GLOBE Oceans Protocol Bundle)
The GLOBE database provides data submitted by individuals for specific protocols which can be used in investigations. In addition, there are additional data available in the My NASA Data Earth System Data Explorer. These data can provide context and background information or provide data for additional locations. There are also data for additional parameters not included in GLOBE.
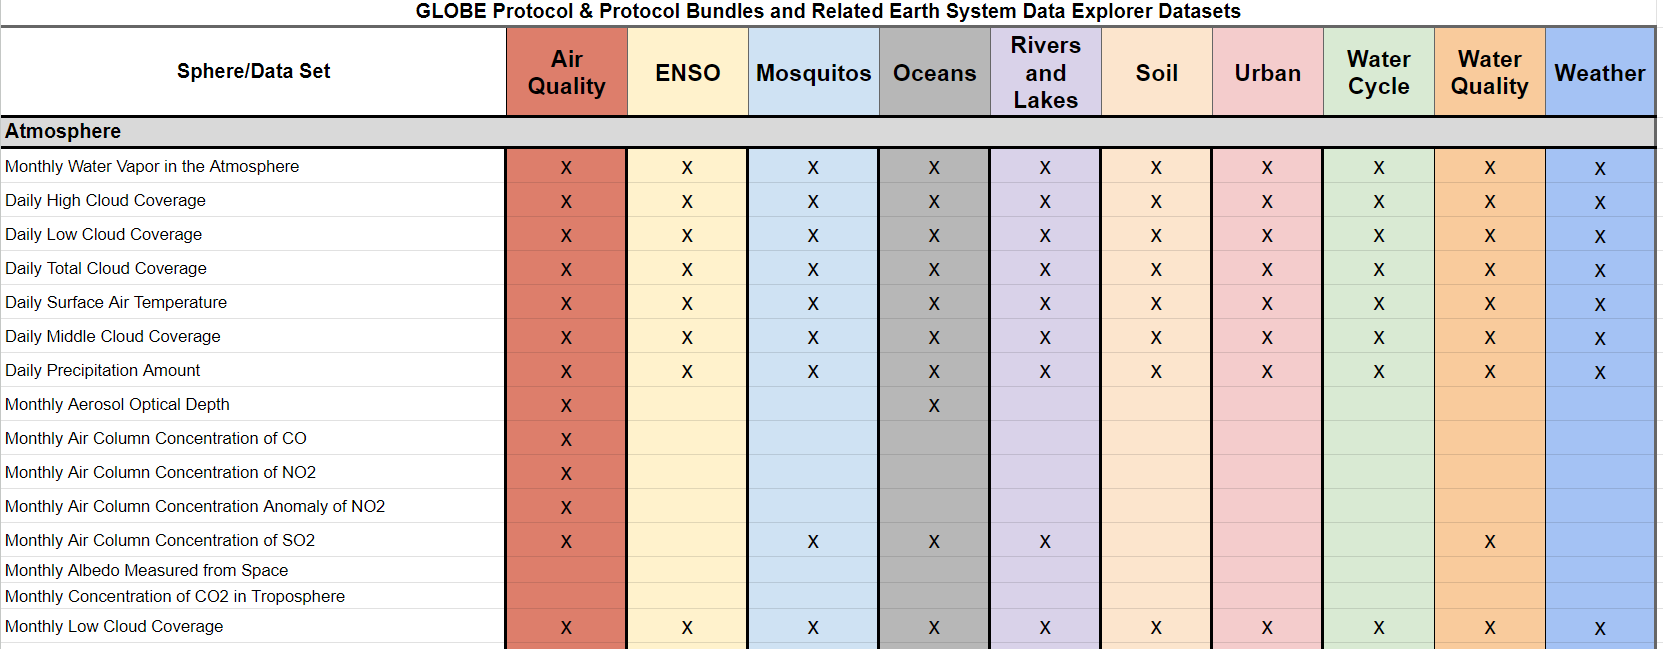
When learning about oceans, many of the interrelated variables can be explored through the Earth System Data Explorer which has numerous data sets. Some of these are directly related to a GLOBE protocol which is part of the Oceans protocol bundle. Others are indirectly related. The data sets below have been identified as those that can complement these investigations. The specific GLOBE protocols used in the bundle can be found in the section below the related Earth System Data Explorer data sets section.
Related Earth System Data Explorer data sets:
Explore the MND GLOBE Connections Datasets spreadsheet to review the range of datasets available to integrate with GLOBE Protocol Bundle research by visiting the link.
Dataset Recommendations and Rationale:
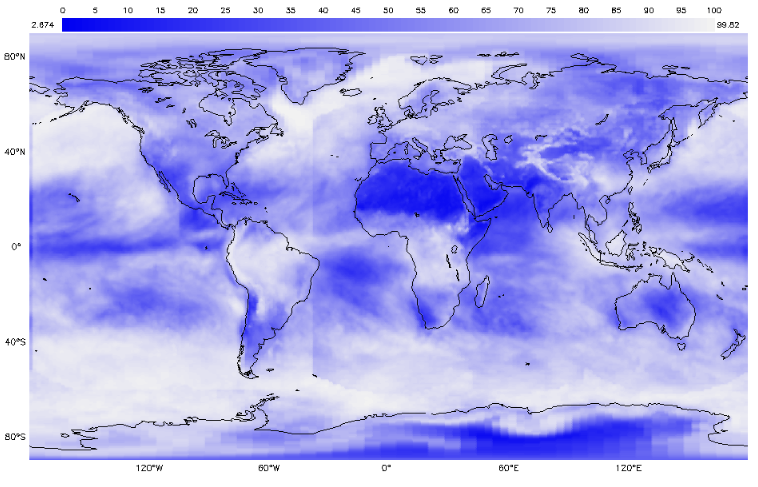
Aerosols can include ocean spray as well as dust, smoke and other aerosols and can travel over the oceans. Students can compare daily measurements with monthly aerosol optical depth averages over oceans. They can examine historical data and seasonal trends.
- Monthly Aerosol Optical Depth
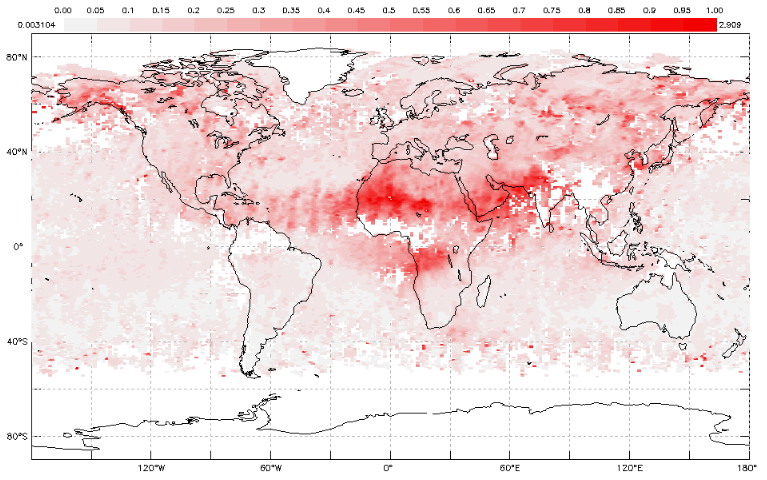
Monthly Aerosol Optical Thickness - July 2019
Air temperature data sets allow students to explore daily and monthly average temperatures and anomalies. Surface temperature data are also available. These data can be used in conjunction with sea surface temperature data.
- Daily Surface Air Temperature
- Monthly Daytime Surface (Skin) Temperature
- Monthly Surface Air Temperature
- Monthly Surface Air Temperature Anomaly
- Monthly Nighttime Surface (Skin) Temperature
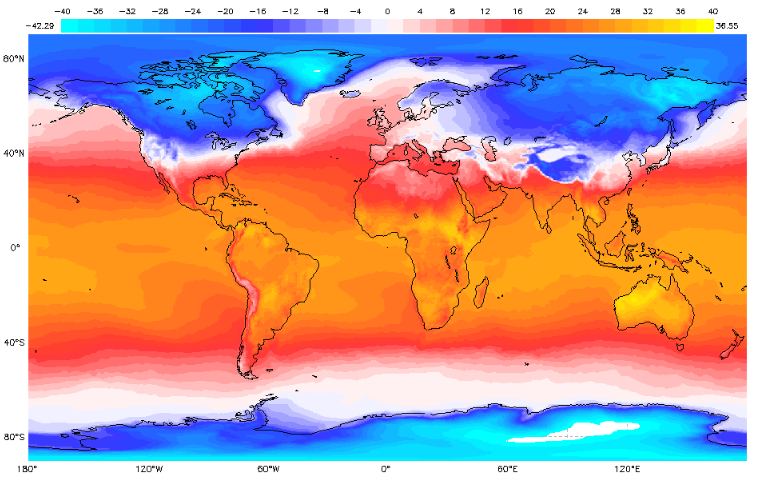
Monthly Surface Air Temperature - February 2019
Chlorophyll levels are related to all organisms in the ocean that have chlorophyll. It is also related to dissolved oxygen, nitrates and water transparency.
- Monthly Chlorophyll Concentration
Cloud data sets can be used for comparison with student cloud observations and background research. Oceans play an important role in the formation of clouds. There are also data sets which students can use to compare the net flow of energy towards Earth with and without clouds to see the impact of clouds on the energy budget. GLOBE cloud observations also complement GLOBE aerosol observations.
- Daily High Cloud Coverage
- Daily Low Cloud Coverage
- Daily Mean Relative Humidity
- Daily Middle Cloud Coverage
- Daily Total Cloud Coverage
- Monthly Low Cloud Coverage
- Monthly Total Cloud Coverage
- Monthly Flow of Energy into Surface by Shortwave Radiation
Monthly Total Cloud Cover - January 2019
Precipitation data are complemented by cloud data and water vapor data and can be compared with cloud cover. This is an important component of the water cycle along with the oceans.
- Daily Precipitation Amount
- Monthly Average Precipitation Rate
- Monthly Water Vapor in the Atmosphere
Salinity can be impacted by sea ice melt. These data show the monthly average sea ice extent across the Northern Hemisphere. The areas in white are where ice is at least partially covering the ocean surface (at least 15% coverage). The formation of sea ice greatly increases the salinity and density of the water at remaining at the surface of the ocean.
- Monthly Sea Ice Extent (Northern Hemisphere)
- Monthly Sea Surface Salinity
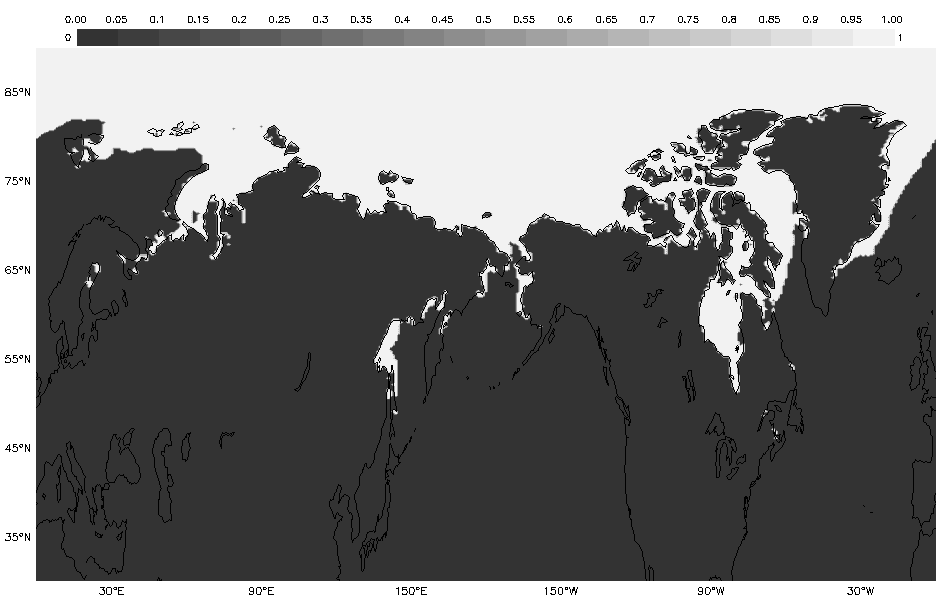
Monthly Sea Ice Extent - December 2017
Sea Surface Height Anomaly and Temperature data are available for investigations about oceans.
- Monthly Sea Level (Sea Surface Height) Anomaly
- Daily Mean Sea Surface Temperature (2005-2014)
- Monthly Mean Sea Surface Temperature
GLOBE Protocols Included:
- Atmosphere
- Aerosols - Measure the aerosol optical thickness of the atmosphere, which is how much of the sun’s light is scattered or absorbed by particles suspended in the air. Students point a GLOBE sun photometer at the sun and record aerosol optical thickness or voltage which is converted to aerosol optical thickness. Students observe sky conditions near the sun, perform the Cloud, Barometric Pressure and Relative Humidity Protocols.
- Air Temperature - Measure the current air temperature when an instrument shelter is not available. Current air temperature is measured using a thermometer held in the open air but in the shade for at least 3 minutes.
- Barometric Pressure - Measure barometric pressure using an aneroid barometer.
- Clouds - Observe and report which types of clouds are visible, how much of the sky is covered by clouds, and the opacity of clouds. Also report sky and surface conditions.
- Precipitation (including pH) - To determine the amount of moisture input to the local environment by measuring rain and snowfall and to measure the pH of precipitation.
- Relative Humidity - Students measure the relative humidity using either a digital hygrometer or a sling psychrometer.
- Biosphere
- Land Cover Classification - Students locate, photograph, and determine the MUC class for 90 m x 90 m areas of homogeneous land cover.
- Hydrosphere
- Dissolved Oxygen - Students will measure dissolved oxygen in the water at their site using a dissolved oxygen test kit or probe.
- Nitrates - Students will measure the nitrate-nitrogen content of water using a nitrate test kit.
- Salinity (Including Titration) - Students will measure the salinity of a salty or brackish water sample using a hydrometer and thermometer.
- Water Temperature - Students will measure the temperature of water.
- Water Transparency - Students will first measure water transparency at their undisturbed study site using a transparency tube or Secchi disk.
- Pedosphere (Geosphere)
- Soil pH - Students will prepare a one-to-one mixture of dry soil and distilled water and then measure the pH of the liquid left after most of the soil has settled to the bottom of the mixture.
- Soil Temperature - Students will measure near-surface soil temperature frequently near local solar noon and seasonally throughout two diurnal cycles.