GLOBE Connections
GLOBE Protocol Bundle: Mosquito
Mosquito
According to the World Health Organization, more than 50% of the world’s population is at risk of contracting a mosquito-borne disease. Mosquitoes infect hundreds of millions of people with diseases such as yellow fever, malaria and dengue, and kill more than a million people each year.
By making observations and recording data using the GLOBE Observer App's Mosquito Habitat Mapper tool, you can report information about the mosquitoes that you find locally and contribute to reducing the risk of disease outbreaks in your community. (Source: GLOBE Mosquito Bundle)
GLOBE Observer
Mosquito Habitat Mapper - This citizen science tool provides a way to make and submit observations which will supplement satellite-based observations.
Land Cover - This citizen science tool allows you to make and submit land cover observations to be archived with the GLOBE program.
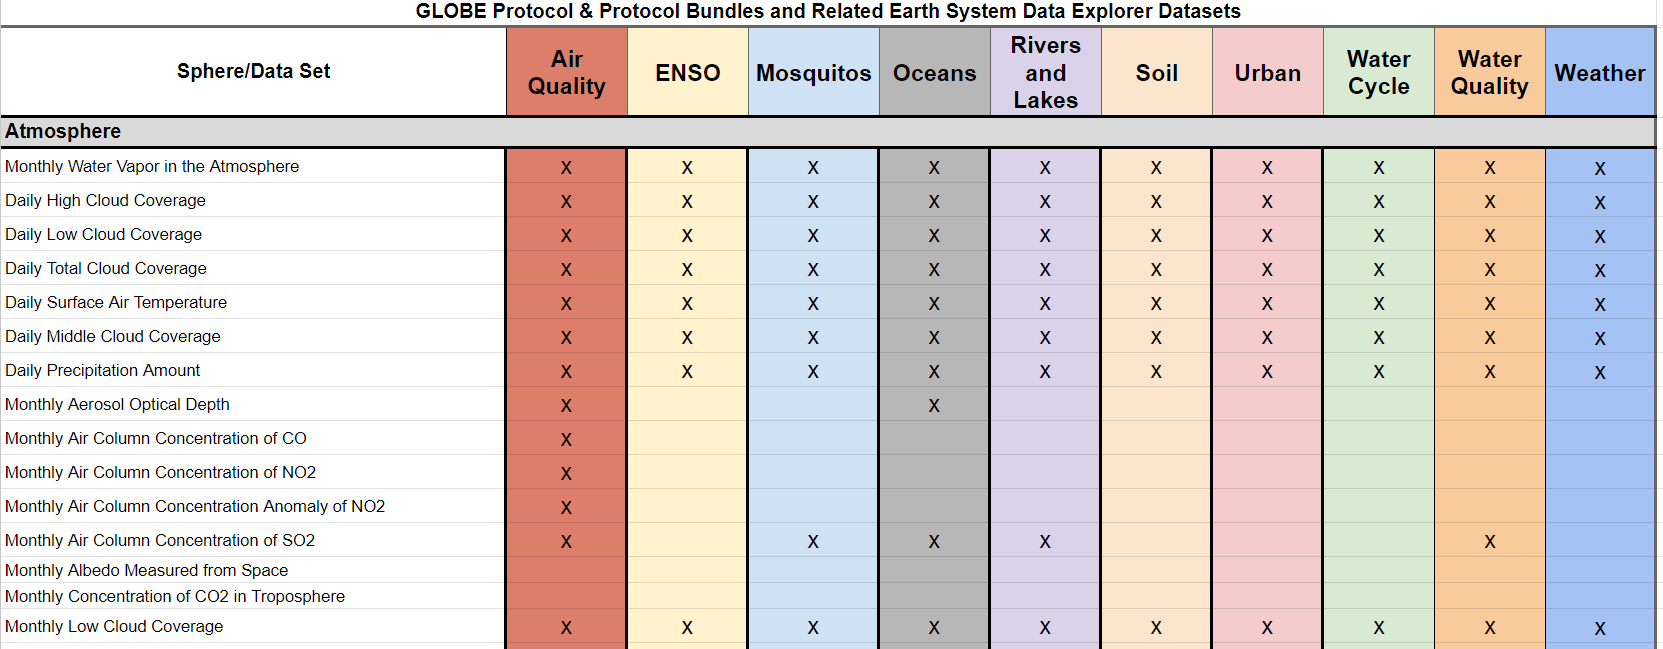
Related Earth System Data Explorer Datasets:
The GLOBE database provides data submitted by individuals for specific protocols which can be used in investigations. In addition, there are additional data available in the My NASA Data Earth System Data Explorer. These data can provide context and background information or provide data for additional locations. There are also data for additional parameters not included in GLOBE.
When investigating mosquitoes, there are many interrelated variables that can be explored through the Earth System Data Explorer. Some of these are directly related to a GLOBE protocol which is part of the Mosquito protocol bundle. Others are indirectly related. The data sets below have been identified as those that can complement these investigations. The specific GLOBE protocols used in the bundle can be found in the section below the related Earth System Data Explorer data sets section.
Explore the MND GLOBE Connections Datasets spreadsheet to review the range of datasets available to integrate with GLOBE Protocol Bundle research by visiting the link.
Dataset Recommendations and Rationale:
The temperature data sets allow students to explore daily and monthly average temperatures and anomalies. Temperature can be an indication of when mosquitoes will emerge and subside.
- Daily Surface Air Temperature
- Monthly Surface Air Temperature
- Monthly Surface Air Temperature Anomaly
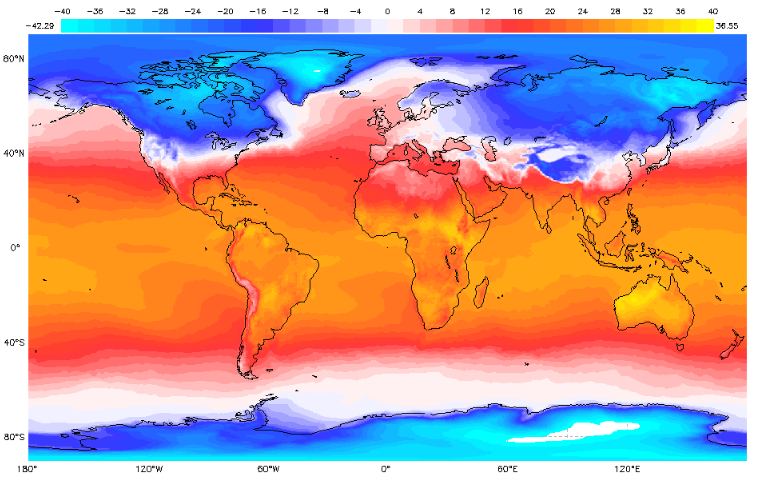
Monthly Surface Air Temperature - February 2019
Precipitation can also be an indicator of mosquito habitat. Precipitation data are complemented by cloud data and water vapor data. Other datasets that can be used to complement investigations include atmospheric water vapor and cloud coverage data. Precipitation and SO2 can also affect the pH of water.
- Daily High Cloud Coverage
- Daily Low Cloud Coverage
- Daily Middle Cloud Coverage
- Daily Total Cloud Coverage
- Monthly Low Cloud Coverage
- Monthly Total Cloud Coverage
- Monthly Water Vapor in the Atmosphere
- Daily Precipitation Amount
- Monthly Average Precipitation Rate
- Monthly Air Column Concentration of SO2
Sea Surface Temperature and Salinity can impact brackish water near coastlines.
- Daily Mean Sea Surface Temperature (2005-2014)
- Monthly Mean Sea Surface Temperature
- Monthly Sea Surface Salinity
GLOBE Protocols Included:
- Atmosphere
- Air Temperature - Students measure the current air temperature when an instrument shelter is not available. Current air temperature is measured using a thermometer held in the open air but in the shade for at least 3 minutes.
- Precipitation (including pH) - Students measure rain, snowfall, and the pH of precipitation to determine the amount of moisture input to the local environment.
- Relative Humidity - Students measure the relative humidity using either a digital hygrometer or a sling psychrometer.
- Hydrosphere
- Dissolved Oxygen - Students measure dissolved oxygen in the water at their site using a dissolved oxygen test kit or probe.
- pH - Students measure the pH of water using either pH paper or a pH meter.
- Salinity - Students measure the salinity of a salty or brackish water sample using a hydrometer and thermometer.
- Water Temperature - Students measure the temperature of water.
- Water Transparency (Turbidity) - Students first measure water transparency at their undisturbed study site using a transparency tube or Secchi disk.
- Biosphere
- Biometry - Students measure properties of vegetation and identify species in order to classify land cover using the MUC System and to provide supplemental information about their site.
- Green-Down - Students use a GLOBE Plant Color Guide to monitor the change in color of selected leaves of trees, shrubs or grasses, to help validate estimates of the end of the plant growing season.
- Green-Up - Students monitor the budburst and growth of leaves of selected trees, shrubs or grasses. Species chosen should be native, deciduous, and dominant in your area.
- Land Cover Classification - Students locate, photograph, and determine the MUC class for 90 m x 90 m areas of homogeneous land cover.
- Pedosphere
- Soil Moisture - There are several GLOBE protocols for soil moisture. This gives students more than one way to determine soil moisture.
- Gravimetric - Students will measure soil water content by comparing the wet and dry masses of samples.
- SMAP Block Pattern - Students will obtain in situ measurements of soil moisture that are consistent with soil moisture measurements from the Soil Moisture Active Passive (SMAP) satellite.
- Soil Moisture - There are several GLOBE protocols for soil moisture. This gives students more than one way to determine soil moisture.