GLOBE Connections
GLOBE Connections: Changes in Snow and Ice Extent
GLOBE protocols and learning activities that complement the Changes in Snow and Ice Extent phenomenon through hands-on investigations are detailed below. Students can conduct their own investigations and see how their data related to global patterns by using GLOBE and My NASA Data together.
Visit the GLOBE Cryosphere Protocols & Related ESDE Datasets page that outlines the datasets available in the Earth System Data Explorer. These data complement student GLOBE investigations using the following protocols.
Changes in Snow and Ice Extent
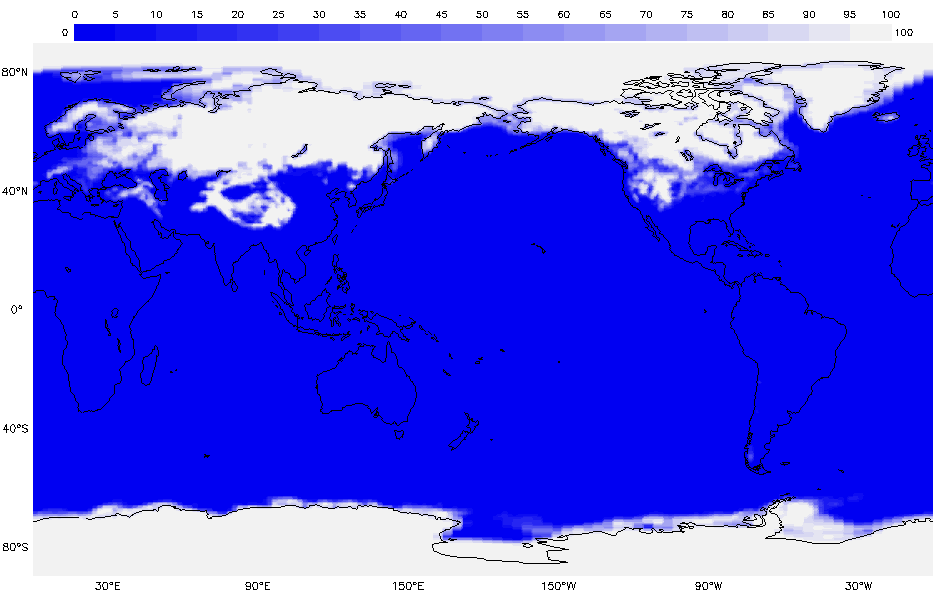
Ice, which covers 10 percent of Earth's surface, is disappearing rapidly. While the Arctic sea ice extent is declining, air temperatures are rising. Vegetation is changing, with tundra being replaced by shrubs. Permafrost is warming and thawing over parts of the Arctic.
Students can use GLOBE protocols to study changing temperatures, permafrost and fresh water ice.
Protocols
GLOBE protocols can be used to collect many types of data to explore the conditions related to formation and melt of sea and land ice. Students can use the protocols to collect data and share their data with other GLOBE students around the world.
Arctic Bird Migration: Over the 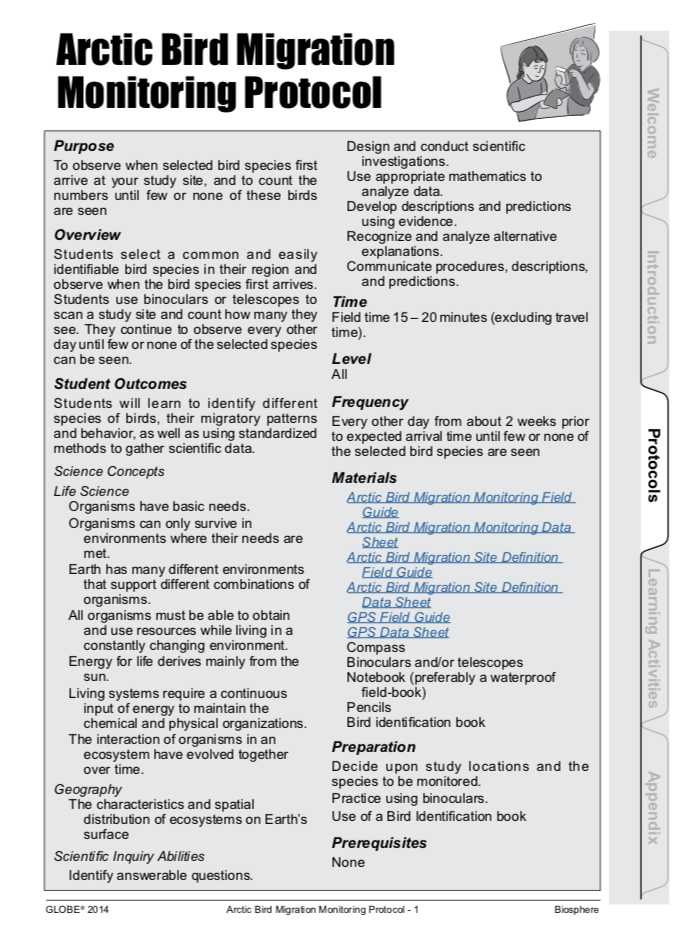 year, students observe when specified migratory bird species first arrive and count their numbers until few or none of them remain.
Student Outcomes:
- Students will learn to identify different species of birds, their migratory patterns and behavior, as well as using standardized methods to gather scientific data
Freshwater Ice Phenology
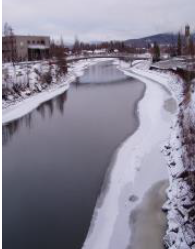
The purpose of the Freshwater Ice Phenology Protocol is to monitor the freeze-up and breakup processes on a selected pond/lake or large creek/river to determine the duration of the annual ice cover. Students will select an easily accessible pond/lake or large creek/river close to their school that is known to develop an ice cover in the winter and observe and document its freeze-up and break-up.
Frost Tube: Students will construct a Frost Tube that is inserted into a hole in an undisturbed and un-compacted soil. During the cold months, students will measure the depth at which water in the Frost Tube freezes, indicating that the surrounding soil has frozen.
Student Outcomes:
- Observe when water in the Frost Tube freezes
- Collect and analyze data related to freezing of soil to understand how soil temperature and moisture coincide with changes in seasons across different biomes
- Examine relationships among air, soil and permafrost
- Communicate project results with other GLOBE schools
- Collaborate with other GLOBE schools (within your country or other countries)
- Share observations by submitting data to the GLOBE archive
- Compare the timing and depth of freezing in soils in different regions around the world
- Predict the timing and depth of freezing for upcoming seasons (advanced)
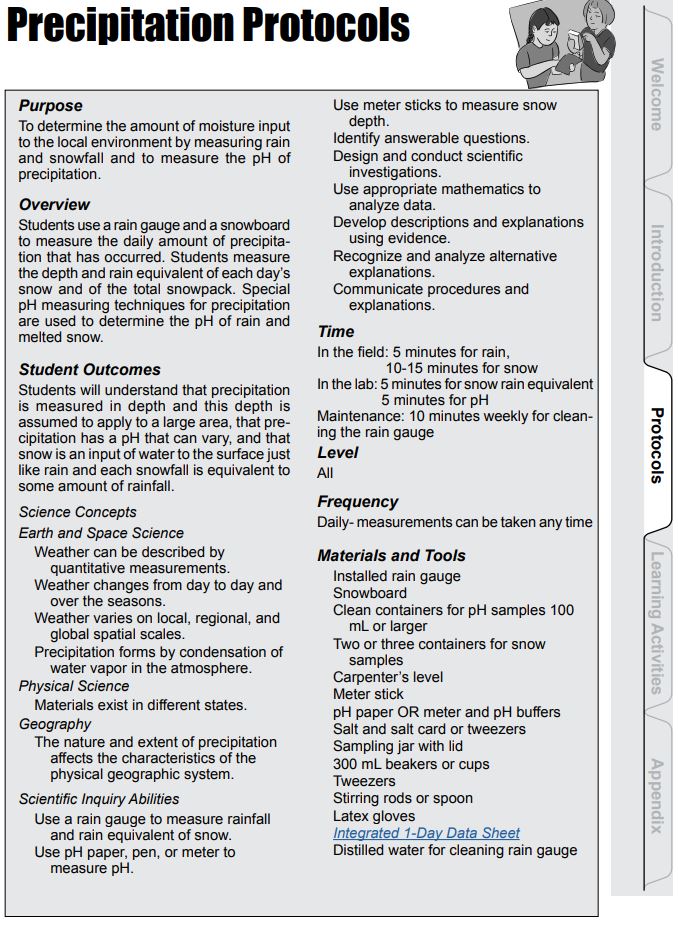
Precipitation
Students use a rain gauge and a snowboard to measure the daily amount of precipitation that has occurred. Students measure the depth and rain equivalent of each day’s snow and of the total snowpack. Special pH measuring techniques for precipitation are used to determine the pH of rain and melted snow.
Student Outcomes:
- Students will understand that precipitation is measured in depth and this depth is assumed to apply to a large area, that precipitation has a pH that can vary, and that snow is an input of water to the surface just like rain and each snowfall is equivalent to some amount of rainfall
Snowboard Construction: A snowboard is a thin, flat surface that rests on top of earlier layers of snow. New snow falls on top of it and can be measured with a meter stick.
Student Outcomes:
- Prepare the snowboard to collect more snow
Solid Precipitation: Students will measure the amount of new snow that has collected on your snowboard in comparison with the total depth of snow on the ground.
Student Outcomes: 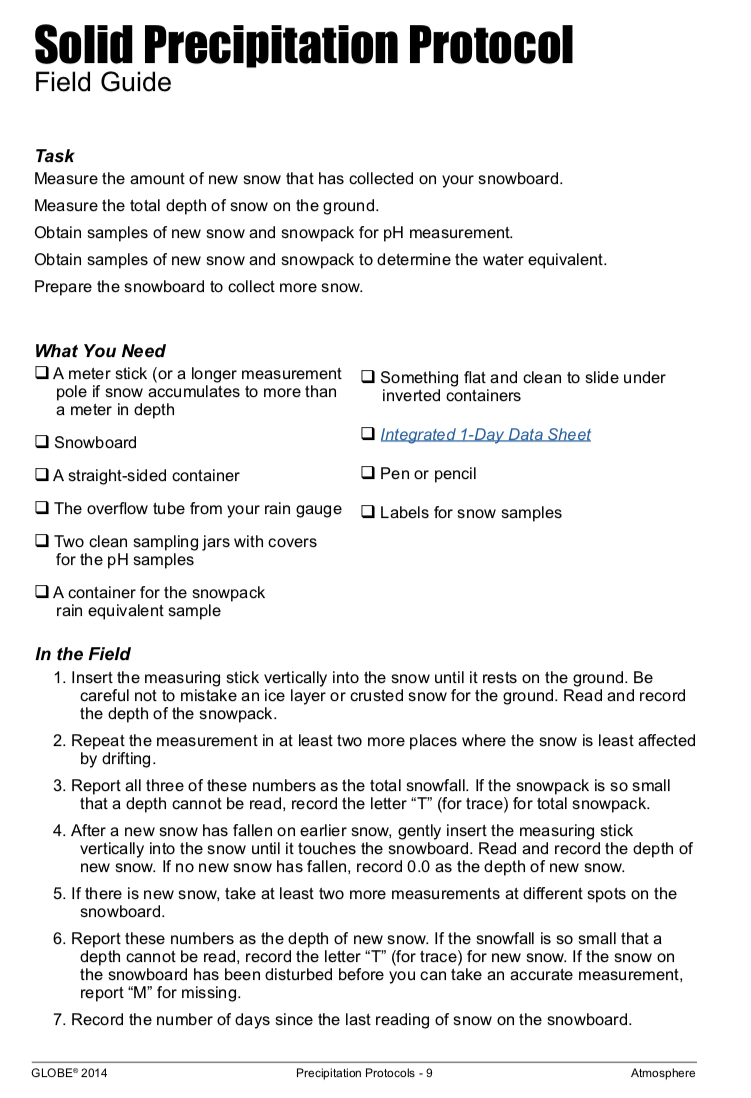
- Students will measure the amount of new snow that has collected on your snowboard
- Students will measure the total depth of snow on the ground
- Students will obtain samples of new snow and snowpack for pH measurement
- Students will obtain samples of new snow and snowpack to determine the water equivalent
- Prepare the snowboard to collect more snow
Learning Activities
Check out the three learning activities to help prepare students for collecting data and to support the integration of MND with GLOBE in your curriculum.
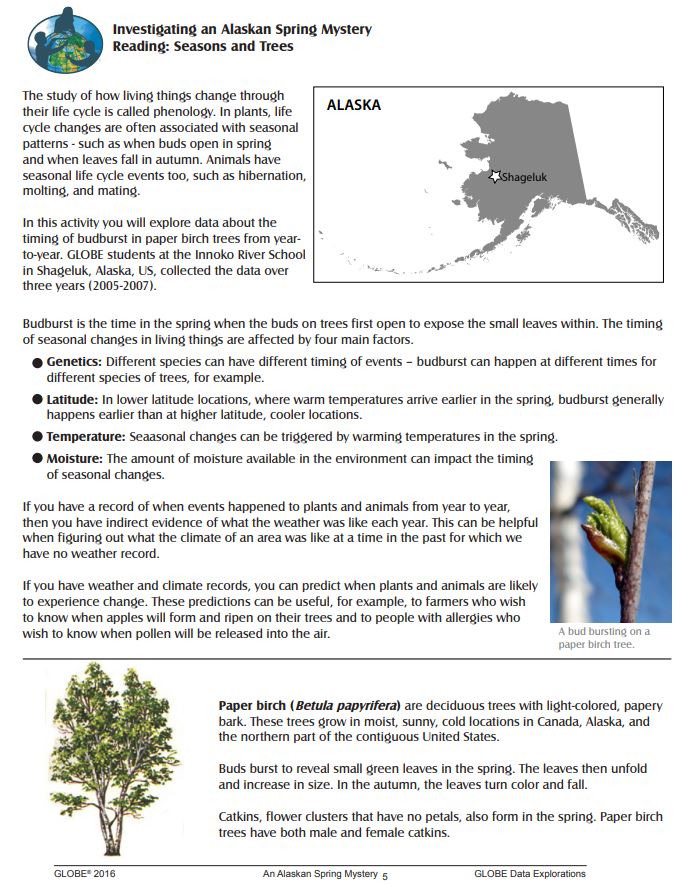 In the GLOBE Learning Activity, An Alaskan Spring Mystery: A GLOBE Data Exploration, students analyze data about the timing of budburst for a tree species over three years in the same location. They investigate two different hypotheses for why timing differs by analyzing weather data from the same time period.
Student Outcomes:
• Analyze different types of data (phenology, temperature, rainfall)
• Form hypotheses based on their analysis of a dataset
• Test hypotheses with environmental data
• Come to a conclusion about the impacts of environmental factors on budburst and explain their reasoning
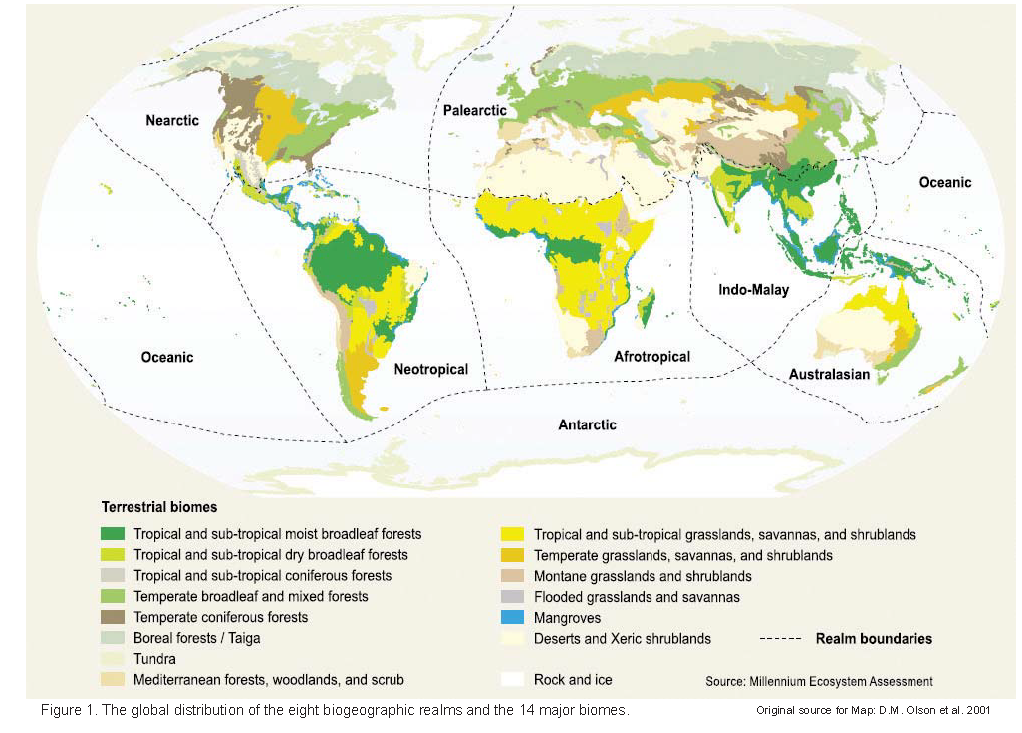
Getting to Know Your Terrestrial Biomes ![]()
Help students become familiar with the Terrestrial Biome Classifications that the Seasons and Biomes project has adopted. Changes in snow and ice extent contribute to biome classification.
Student Outcomes:
- Use appropriate sources of information
- Synthesize data from different sources to create a coherent description of the main biomes
- Identify appropriate sources of information
- Organize data into tables
- Draw conclusions by synthesizing a variety of data
- Communicate results and explanations
How to Make a Climograph from Your Local Weather Data ![]()
![]()
Purpose: Students will assemble, analyze and graph the long-term air temperature and precipitation data for their general area, to understand the difference between weather and climate. These data can include snow and ice.
Student Outcomes:
- Weather is a day-to-day phenomenon and climate is a long-term average of weather
- The sun is the major source of energy for changes on the Earth’s surface
- Organisms’ functions relate to their environment
- Sunlight is the major source of energy for ecosystems
- Identify appropriate data sources
- Perform simple statistical calculations
- Organize data into tables and graphs
- Use appropriate tools and techniques
- Draw conclusions by synthesizing a variety of data
- Communicate results and explanations
Sources:


Sphere(s)
- Cryosphere