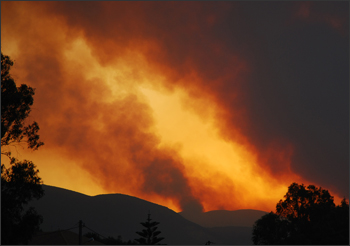
The fires in Greece during the summer of 2007 devastated large tracks of forest and ground cover in this Mediterranean region. Students analyze these data to determine the scale, area, and percentage of the forest impacted by of these fires.
loading Biosphere...
Featured Maps, Graphs, and Data
Explore using units for calculations with Normalized Difference Vegetation Index (NDVI). NDVI is a ratio of different light wavelength reflectance which can be used to map the density of green vegetation.
Explore using units in calculations with the Leaf Area Index (LAI). LAI is a ratio that describes the number of square meters of leaves per square meter of available land surface. Because of the units in the ratio, it is dimensionless.
Students review the NASA video showing biosphere data over the North Atlantic Ocean as a time series animation displaying a decade of phytoplankton blooms and answer questions that follow.
Scientific data are often represented by assigning ranges of numbers to specific colors. The colors are then used to make false color images which allow us to see patterns more easily.
Information from satellites if often used to display information about objects. This information can include how things appear, as well as their contents. Explore how pixel data sequences can be used to create an image and interpret it.