Earth System Data Explorer - Plant Growth Patterns

Earth System Data Explorer. Image Credit: My NASA Data
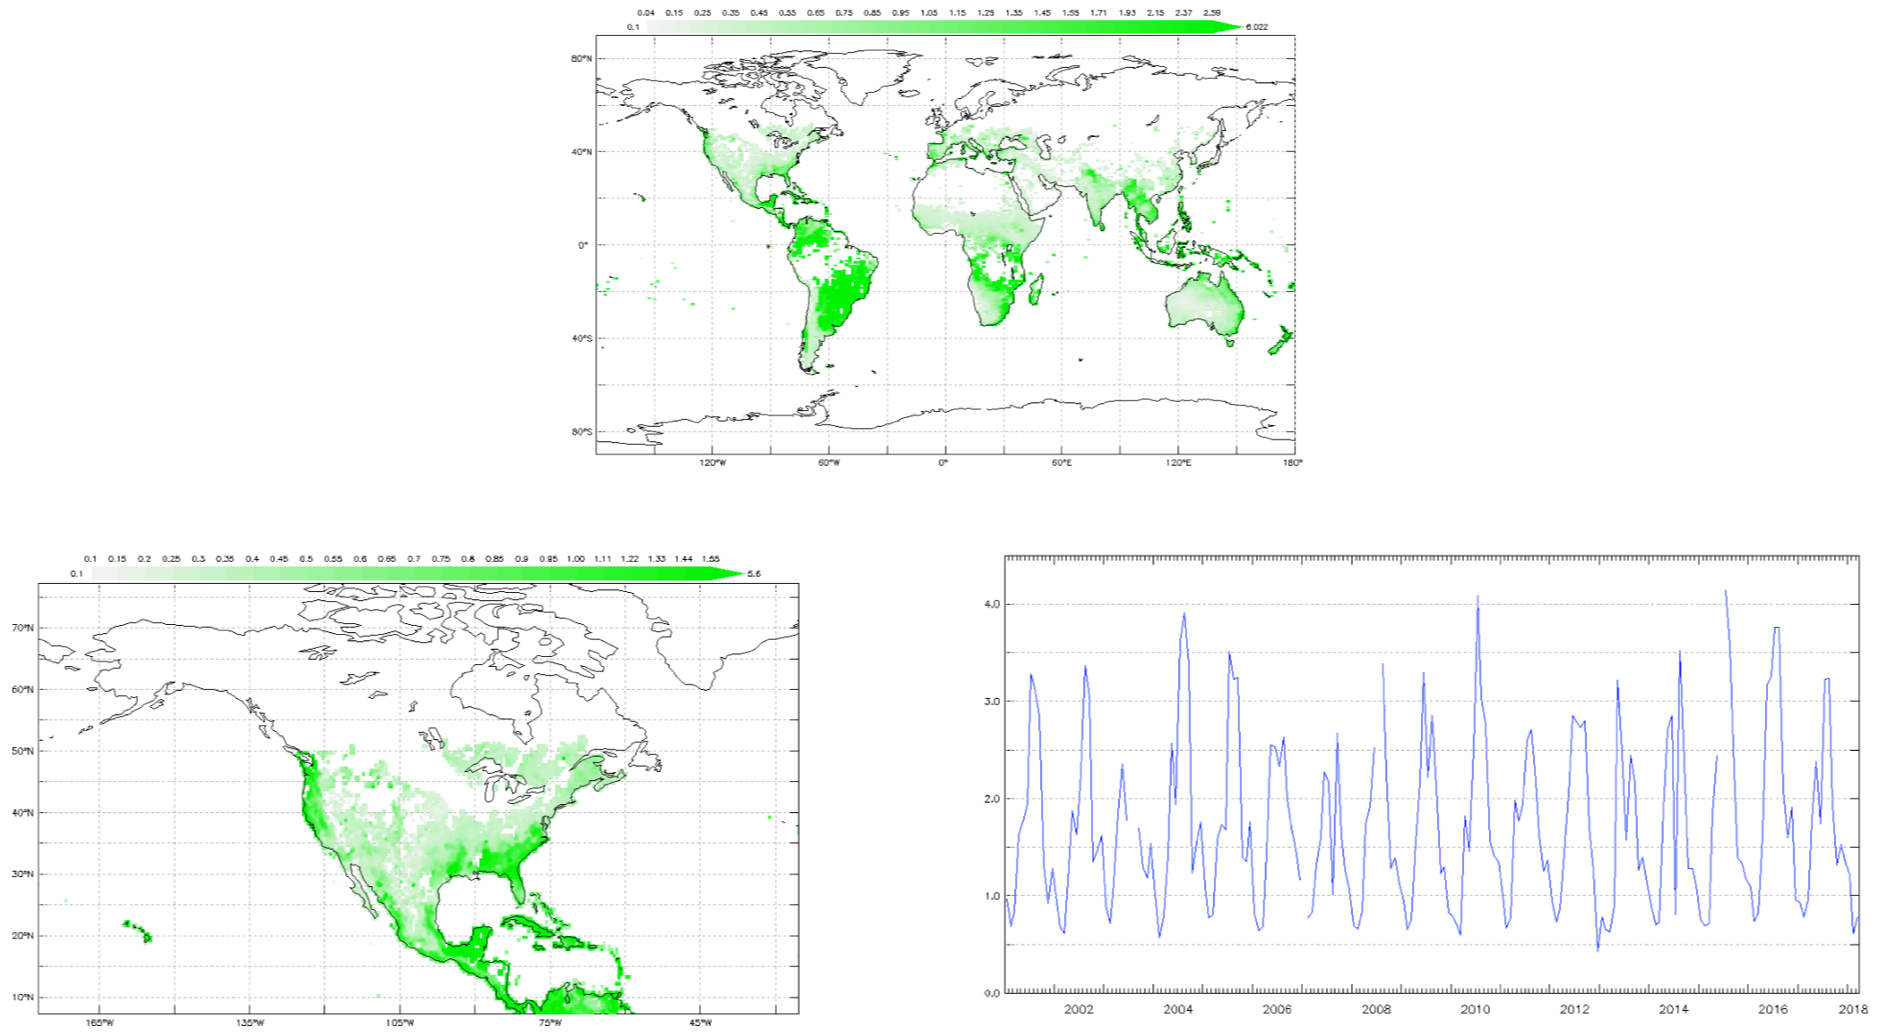
Students can interact with NASA data to build a custom visualizations of local, regional, or global plant growth patterns over time, using the Earth System Data Explorer to generate plots of satellite data as they develop models of this phenomenon.
Visit our YouTube channel for more information on using this visualization tool.
Disciplinary Core Ideas:
Crosscutting Concepts:
- Patterns
- Stability and Change
Science and Engineering Practices:
- Developing and Using Models
- Analyzing and Interpreting Data