Analyzing and Interpreting Data Using MND
Science educators strive to engage students in authentic investigations that have students analyze data in order to derive meaning. MND provides unlimited opportunities to engage students in data analysis using Earth System data.
Why use MND? Data patterns and trends can be hard to observe so scientists use a variety of strategies and representations of data. These tools include organizing data in tables, graphical displays, visualizations, and statistical analysis—to help reveal the most important trends and features of the data. My NASA Data enables interpretation of the large collection of NASA data sets much easier as an extra tool in a teacher's toolbox.
Once collected, data must be presented in a form that can reveal any patterns and relationships and that allows results to be communicated to others. Because raw data as such have little meaning, a major practice of scientists is to organize and interpret data through tabulating, graphing, or statistical analysis. Such analysis can bring out the meaning of data – and their relevance – so that they may be used as evidence. (NRC Framework, 2012, p 61-62)
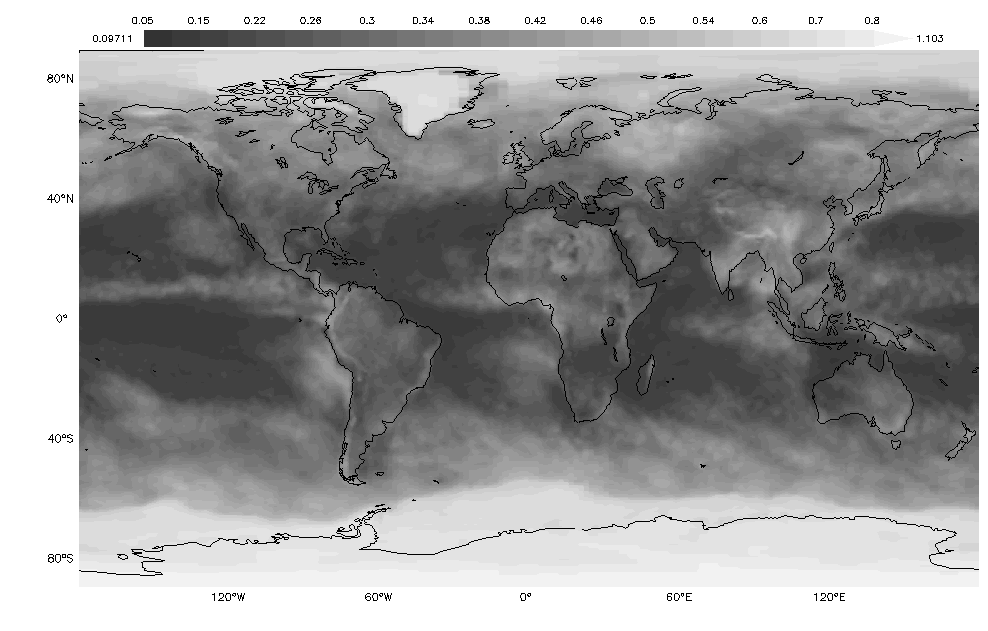
Monthly Albedo Reflected from Top of the Atmosphere with Clouds (fraction)
Example Questions
- What areas of latitude have the highest albedo?
- What factors do you think affect the albedo of those areas?
- How do you predict for these data would change over time?
K-2: Analyzing data in K-2 builds on prior experiences and progresses to collecting, recording, and sharing observations.
- Use observations (firsthand or from media) to describe patterns in the natural world in order to answer scientific questions. (K-ESS2-1) (1-ESS1-1)
3-5: Analyzing data in 3-5 builds on K-2 experiences and progresses to introducing quantitative approaches to collecting data and conducting multiple trials of qualitative observations. When possible and feasible, digital tools should be used.
- Represent data in tables and various graphical displays (bar graphs and pictographs) to reveal patterns that indicate relationships. (3-ESS2-1)(5-ESS1-2)
- Analyze and interpret data to make sense of phenomena using logical reasoning. (4-ESS2-2)
6-8: Analyzing data in 6-8 builds on K-5 experiences and progresses to extending the quantitative analysis to investigations, distinguishing between correlation and causation, and basic statistical techniques of data and error analysis.
- Analyze and interpret data to determine similarities and differences in findings. (MS-ESS1-3)(MS-ESS3-2)
- Analyze and interpret data to provide evidence for phenomena. (MS-ESS2-3)
9-12: Analyzing data in 9-12 builds on K-8 experiences and progresses to introducing more detailed statistical analysis, the comparison of data sets for consistency, and the use of models to generate and analyze data.
- Analyze data using tools, technologies, and/or models (e.g., computational, mathematical) in order to make valid and reliable scientific claims or determine an optimal design solution. (HS-ESS2-2) (HS-ESS3-5)


