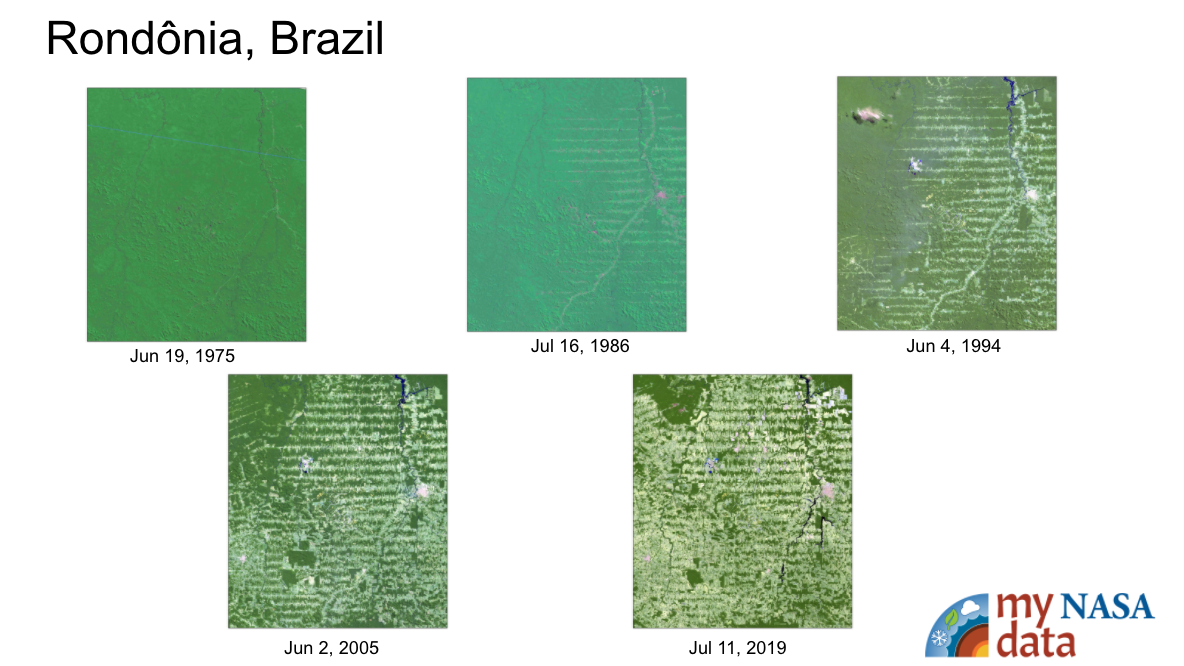
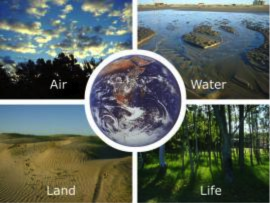
The activities in this guide will help students understand variations in environmental parameters by examining connections among different phenomena measured on local, regional and global scales.
List of all Geosphere Lesson Plans
In this activity, students investigate three different soil samples with varying moisture content. They use a soil moisture probe to determine the percentage (by volume) of water in each of the soil samples.
The purpose of this activity is for students to create a desktop soil profile based on the biome region of the United States where your school is located.
Use the Data Literacy Cube to guide students’ exploration of data to enrich their observations and inferences. This is a flexible resource that may be used with a variety of graphical representations of data. This activity requires a graph for students to evaluate. Fo
NASA visualizers take data – numbers, codes – and turn them into animations people can see and quickly understand.
The purpose of this activity is to have students use an Earth Systems perspective to identify the various causes associated with changes to Earth's forests as they review Landsat imagery of site locations from around the world.
This activity was developed by NASA's Global Precipitation Measurement (GPM) team as an introductory experience to a series of lessons about water resources on Earth.
In this NASA-JPL lesson, students create a model of a volcano, produce and record lava flows, and interpret geologic history through volcano formation and excavation.
In this activity, students explore the Urban Heat Island Effect phenomenon by collecting temperatures of different materials with respect to their locations.
Students collect and analyze temperature data to explore what governs how much energy is reflected.