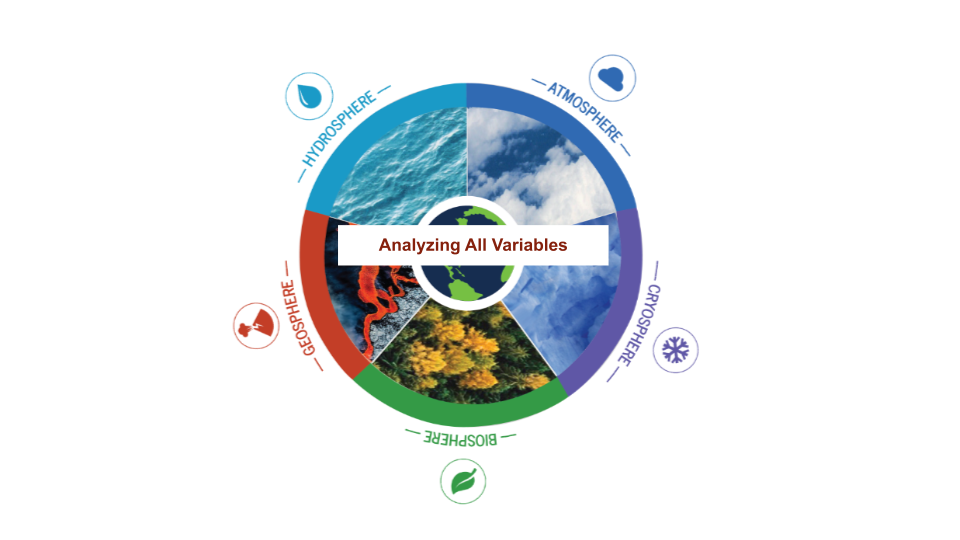
The activities in this guide will help students understand variations in environmental parameters by examining connections among different phenomena measured on local, regional and global scales.
List of all Biosphere Lesson Plans


Students analyze historic plant growth data (i.e., Peak Bloom dates) of Washington, D.C.’s famous cherry blossom trees, as well as atmospheric near surface temperatures as evidence for explaining the phenomena of earlier Peak Blooms in our nation’s capital.
NASA visualizers take data – numbers, codes – and turn them into animations people can see and quickly understand.
Students are introduced to the Earthrise phenomenon by seeing the Earth as the Apollo 8 astronauts viewed our home planet for the first time from the Moon. They will analyze a time series of mapped plots of Earth science variables that NASA monitors to better understand the Earth
This investigation is part of the NASA: Mission Geography Module "What are the causes and consequences of climate change?" that guides students through explorations in climatic variability and evidence for global climate change.
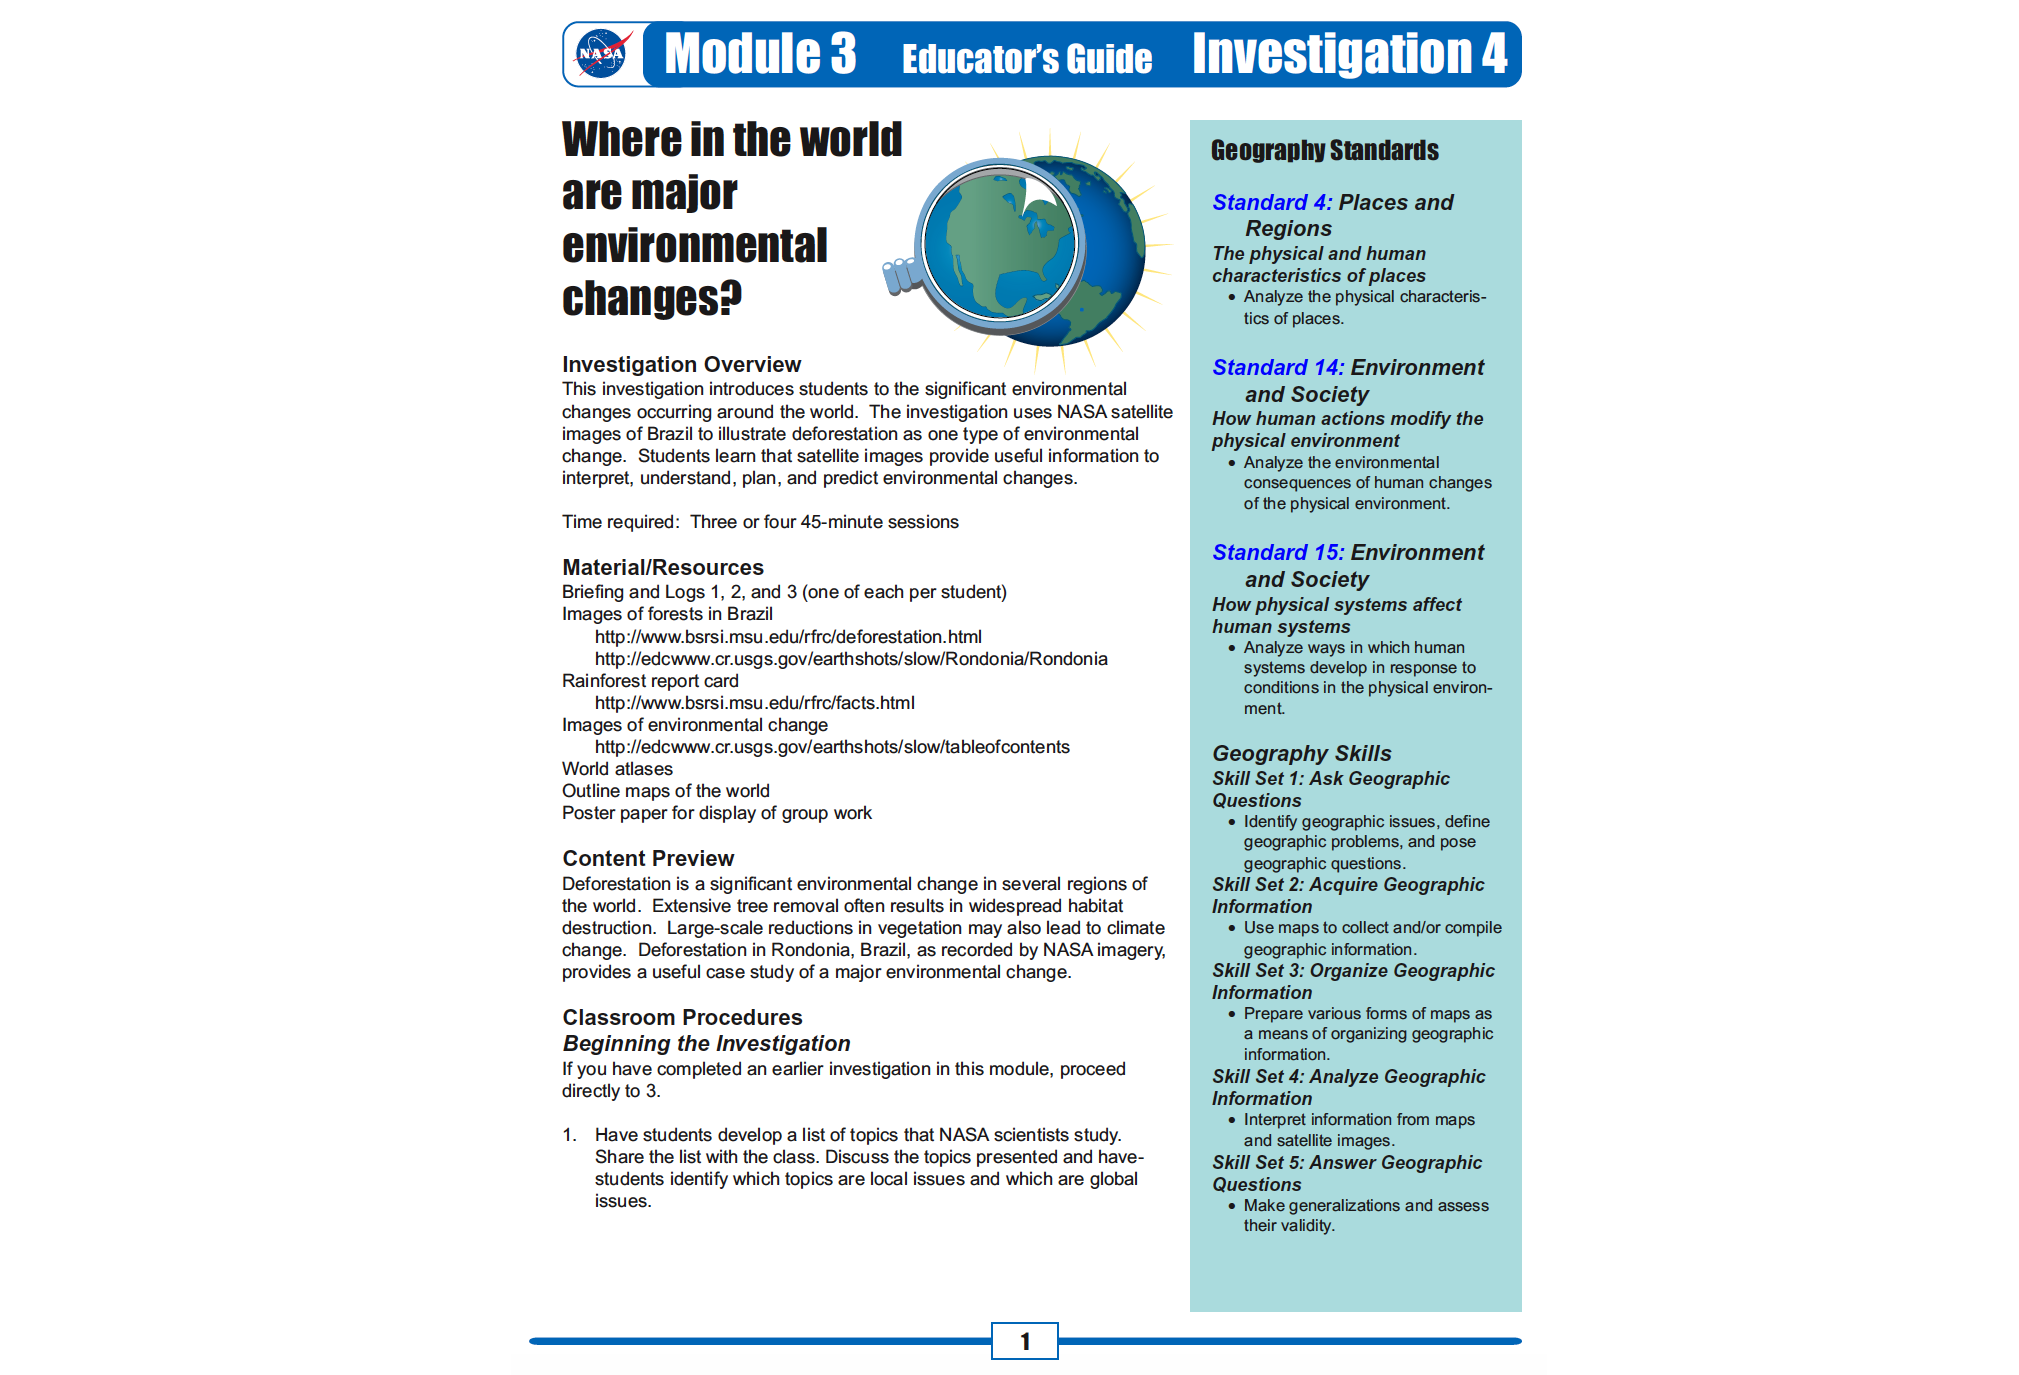
This investigation introduces students to the significant environmental changes occurring around the world. The investigation uses NASA satellite images of Brazil to illustrate deforestation as one type of environmental change.
Air, Water, Land, & Life: A Global Perspective
This lesson is taken from NASA's Phytopia: Discovery of the Marine Ecosystem written in partnership with Bigelow Laboratory for Ocean Science with funding from the National Science Foundation.
Students use Phytopia: Exploration of the Marine Ecosystem, a computer-based tool, to investigate various phytoplankton species and topics relating to phytoplankton biology.
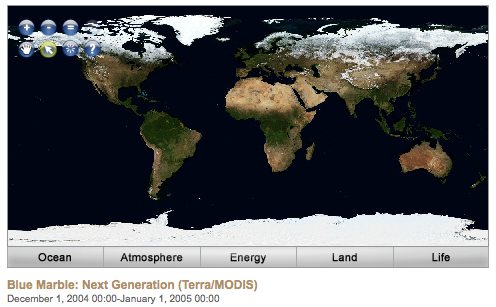
The Earth System Satellite Images, help the learner visualize how different Earth system variables change over time, establish cause and effect relationships for a specific variable, identify patterns, and determine relationships among variables over one year.


