
Grade Level: 3-5,
6-8
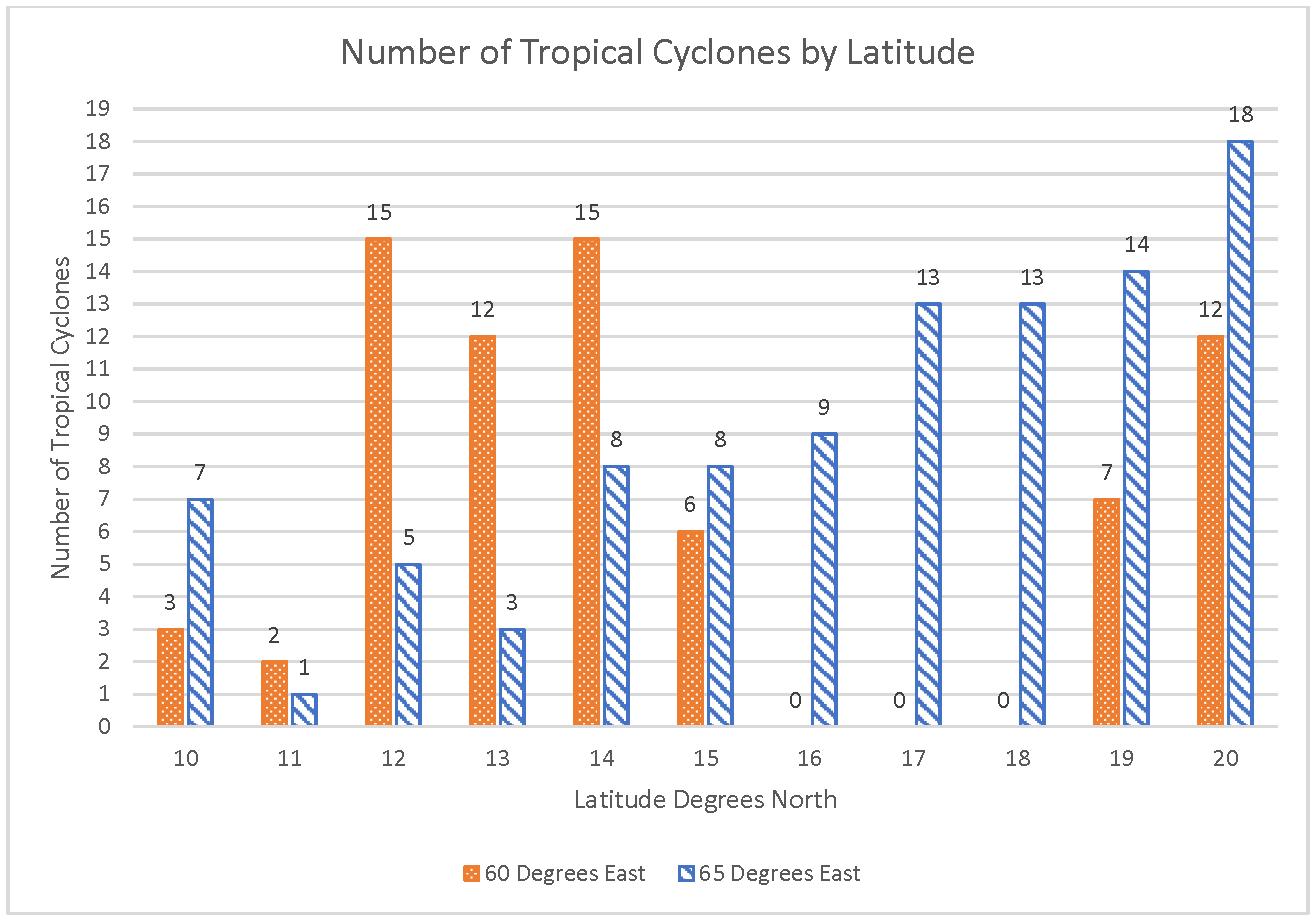
Students interpret a double bar/column chart comparing the number of tropical cyclones in different locations.
Select a Sphere:


Students interpret a double bar/column chart comparing the number of tropical cyclones in different locations.
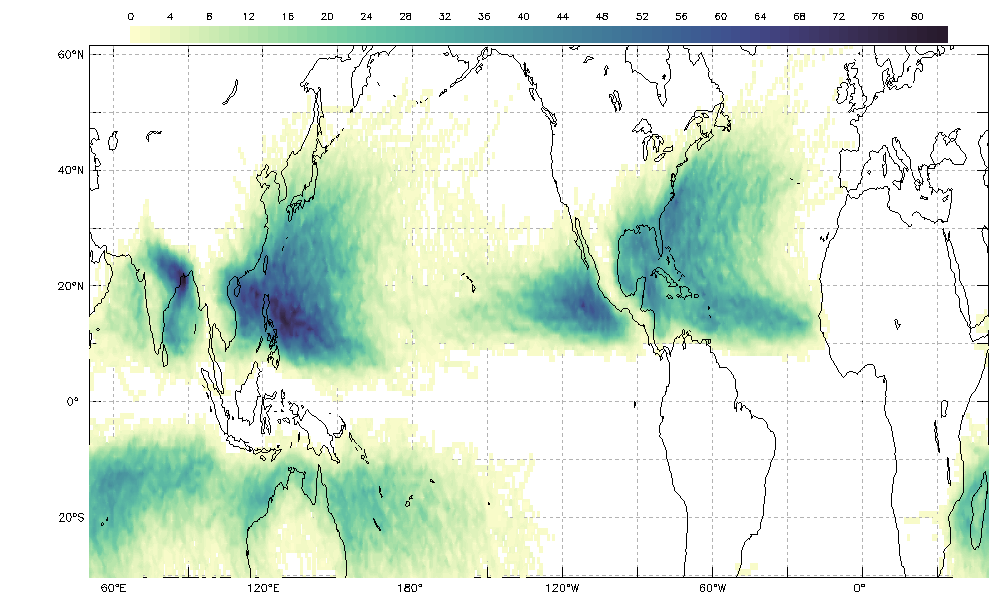
Interpret the map, or model, to find patterns in the occurrence of tropical cyclones from 1842 through 2018.
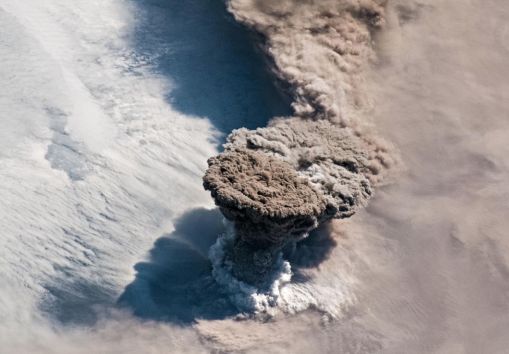
Compare images from two volcanic eruptions in the Kuril Islands which occurred ten years apart and complete a graphic organizer for impacts on different Earth spheres.
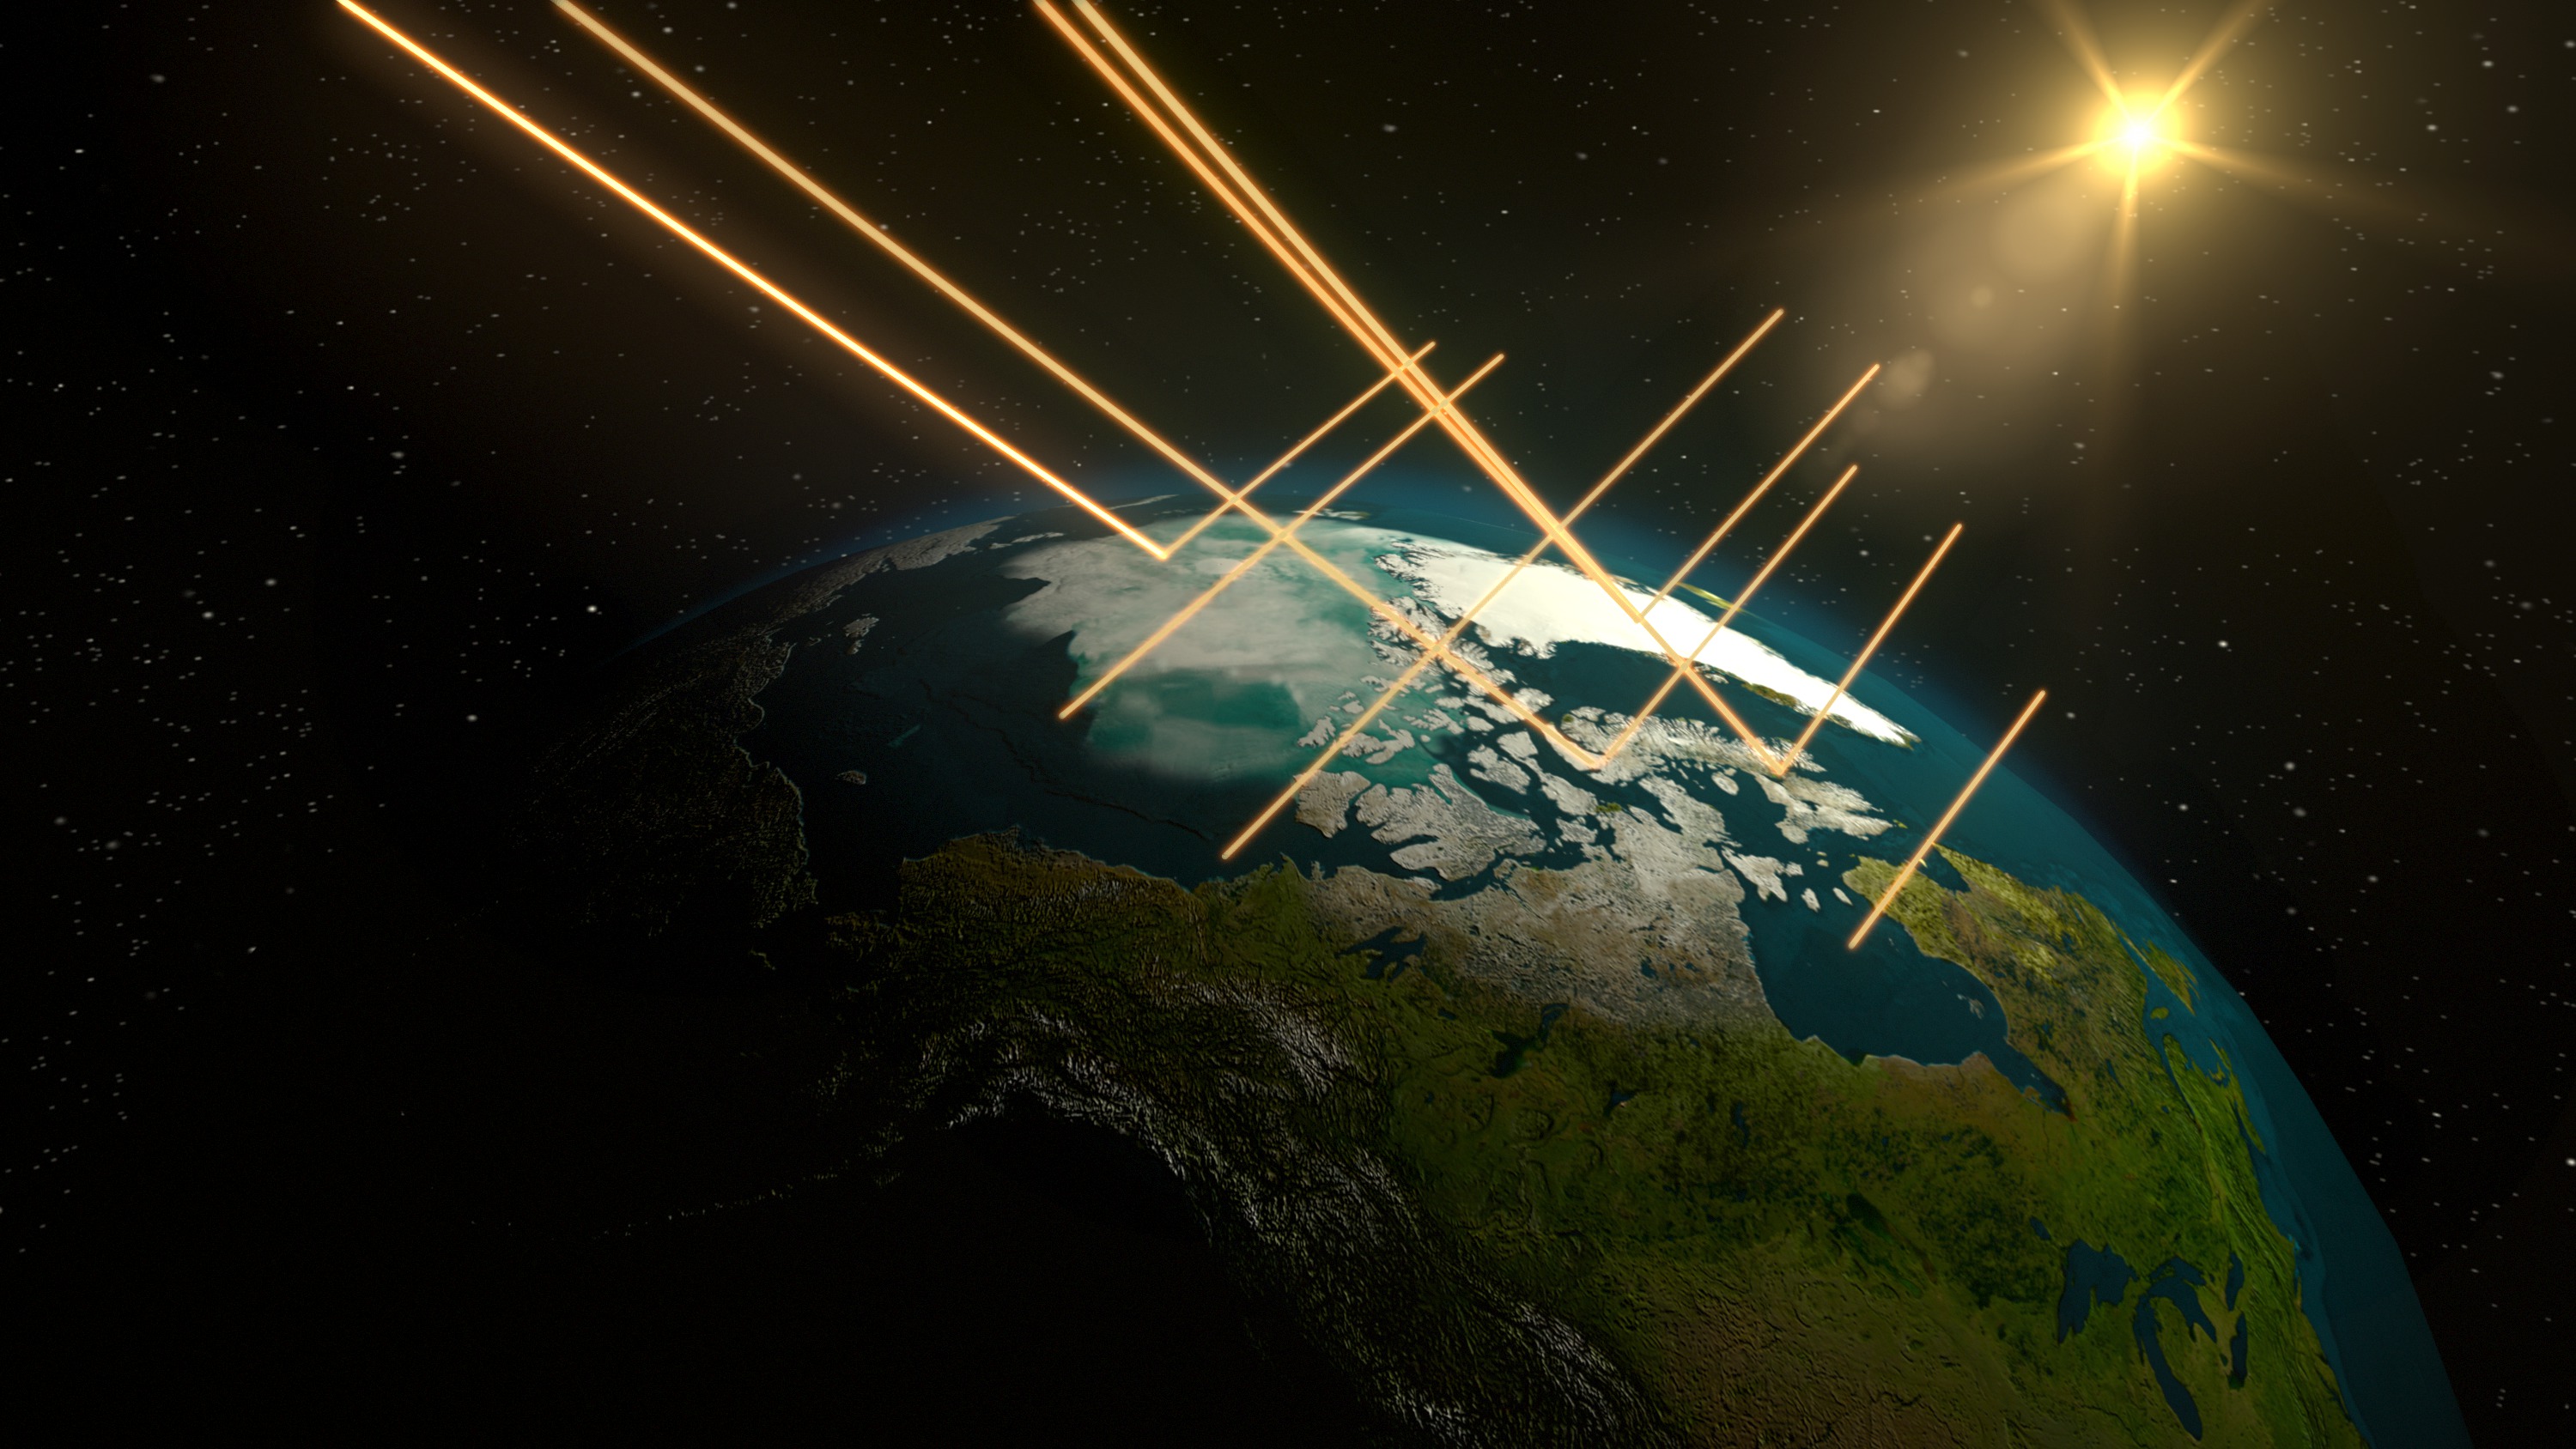
Students watch a video introducing the concept of albedo and answer questions.
Help learners envision themselves as explorers, scientists, technologists, engineers, and mathematicians as they venture into the summer months. Download the PDF of the two sided document on cardstock and have students imagine and illustrate themselves!
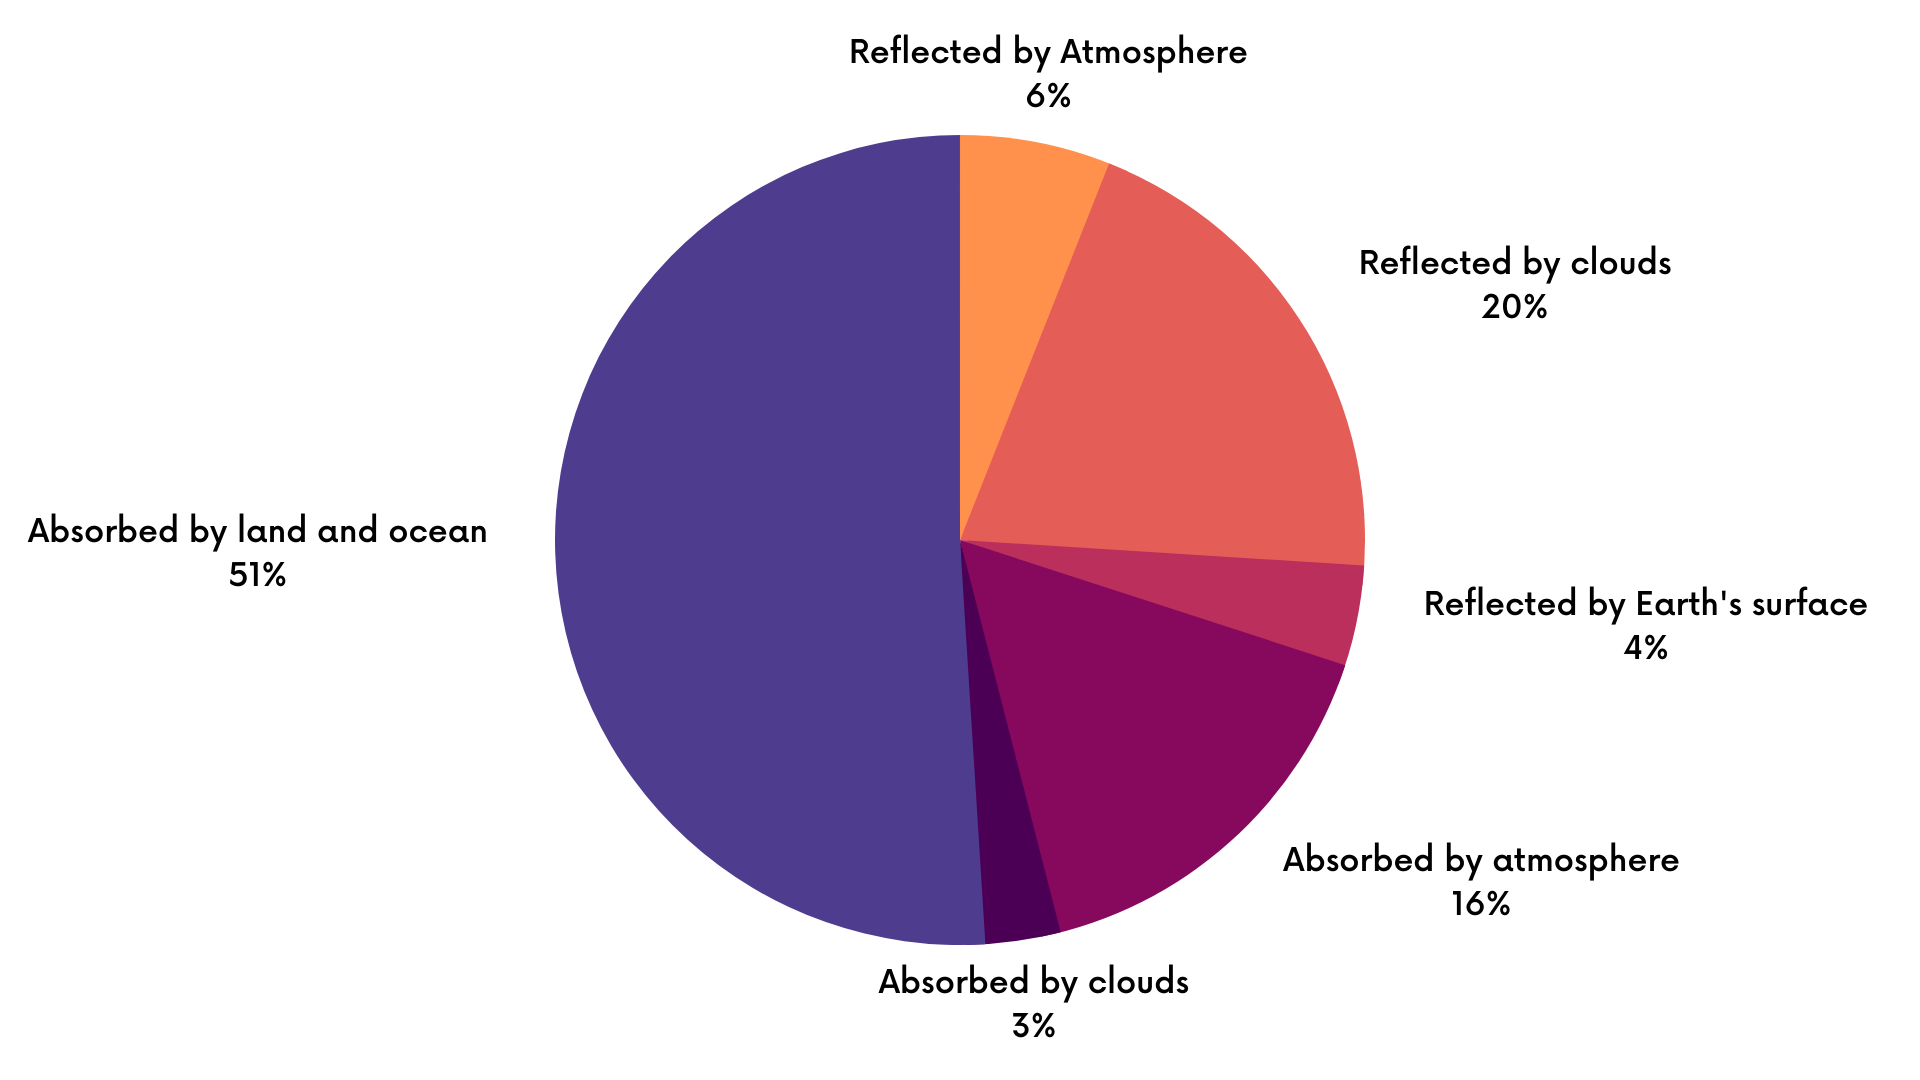
Students will analyze a pie chart (circle graph) showing the distribution of different parts of the Earth system's absorption and reflection of energy.
Mini lessons are intended to be short engagement activities that teachers may assign as bell-ringers, exit slips, or parts of larger learning lessons. These include activities where students interact with NASA maps, graphs, and datasets from the atmosphere, biosphere, cryosphere, geosphere, hydrosphere and the earth system.
