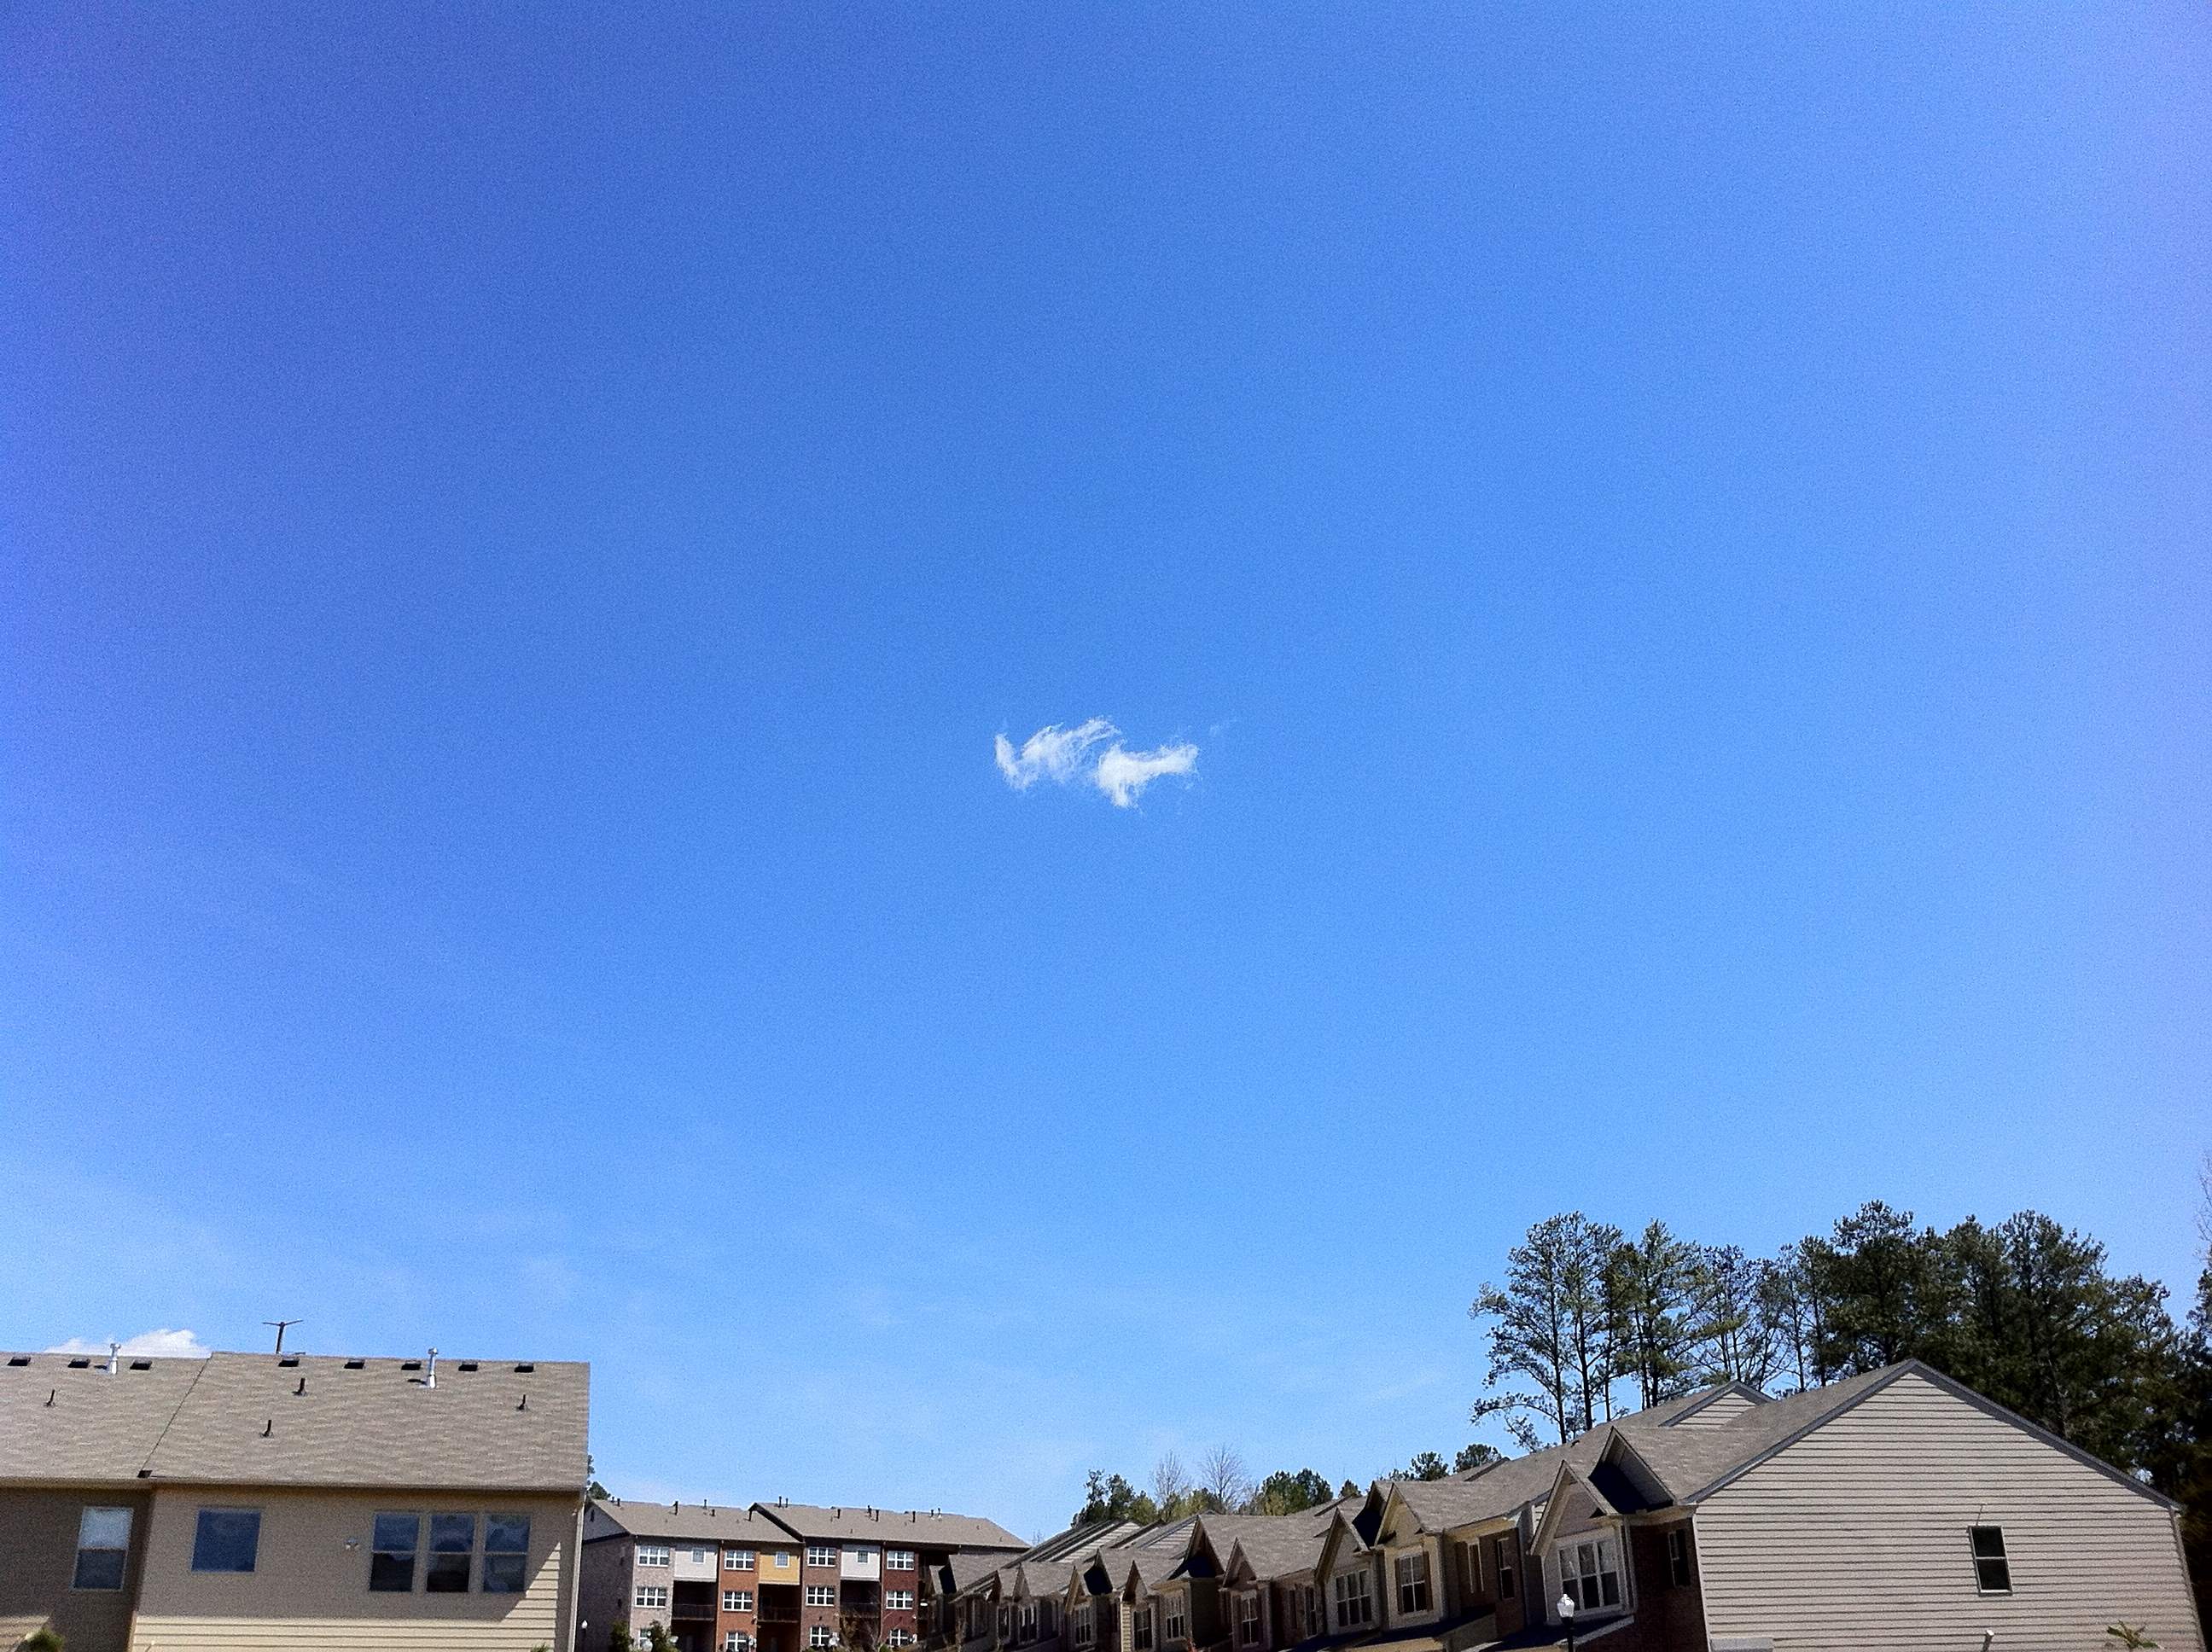
Students will analyze and interpret graphs to compare the flow of (shortwave) energy from the Sun toward China over the course of a year on cloudy versus clear days. Students will draw a conclusion and support it with evidence.
List of all Atmosphere Lesson Plans


The activities in this guide will help students understand variations in environmental parameters by examining connections among different phenomena measured on local, regional and global scales.
In this activity, we will introduce children to the colors of the sky. Children love to look at clouds. Here we will focus in on the sky in which clouds float. Children will learn why the sky has such a wide range of colors.
NASA visualizers take data – numbers, codes – and turn them into animations people can see and quickly understand.
This activity is designed to introduce students to geologic processes on Earth and how to identify geologic features in images. It will also introduce students to how scientists use Earth to gain a better understanding of other planetary bodies in the solar system.
Because it recognizes the importance of U.S. coastal areas to the nation's economy, the U.S. National Ocean Service has formed a task force that is studying the trends and impacts of hurricanes on coastal regions. They have invited your students to participate.
This activity was developed by NASA's Global Precipitation Measurement (GPM) team as an introductory experience to a series of lessons about water resources on Earth.
This content has been moved. You can find it under Creation of Urban Heat Islands Story Map link.
In this activity, students explore the Urban Heat Island Effect phenomenon by collecting temperatures of different materials with respect to their locations. This activity was modified from The NASA PUMAS Collection's "What makes cities hot?
Learners follow adventurous camper, Awenasa, as she travels the United States and attends various camp locations throughout the year. Learners analyze data to find her location among the various campsites using monthly averaged NASA satellite data (Cloud Coverage, S