
Interactive Models
El Niño Southern Oscillation Interactive
Overview
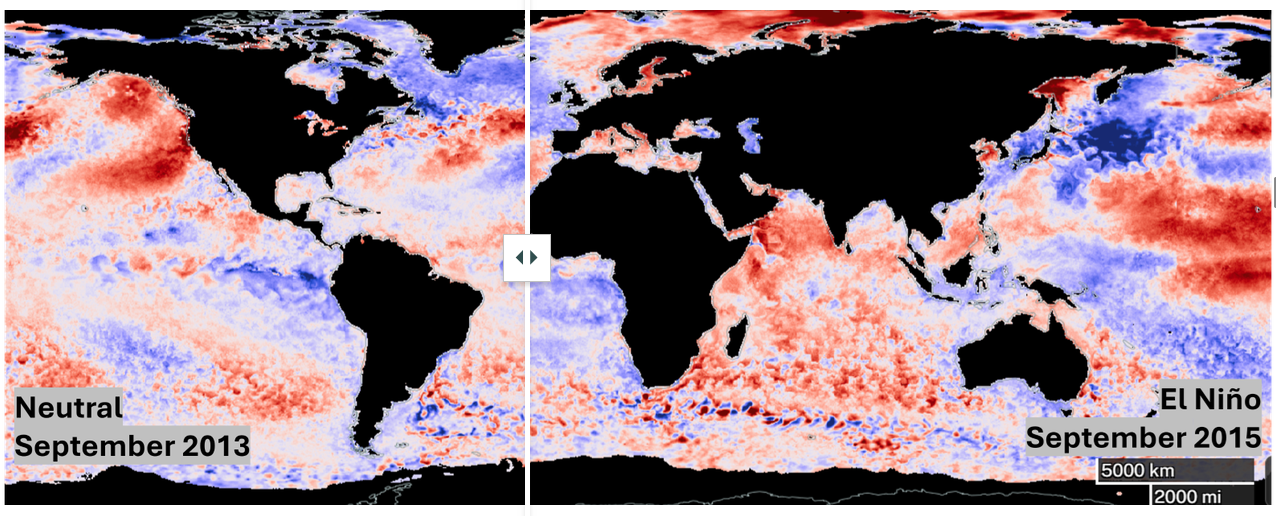
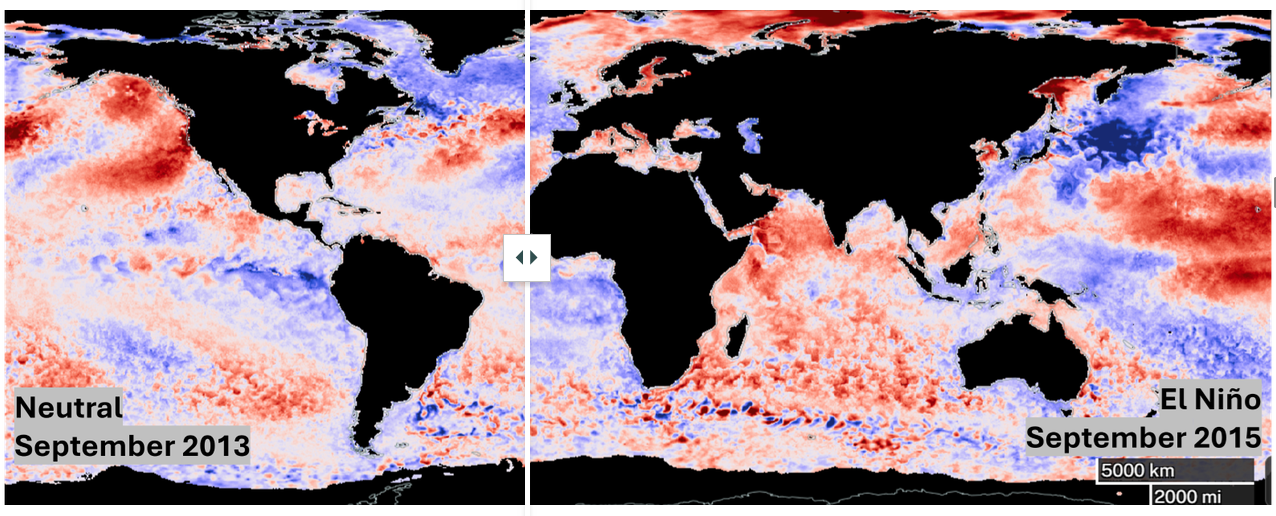
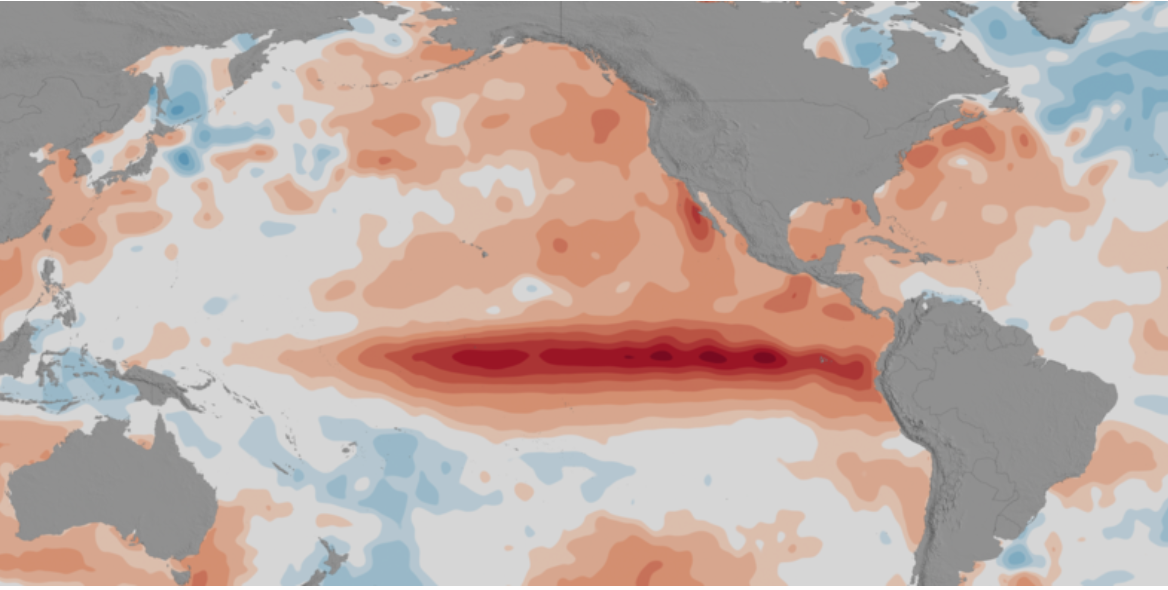
Using maps of sea surface temperature anomaly, students will identify patterns to understand an important indicator of El Niño Southern Oscillation.
This StoryMap is intended to be used with students who have access to a computing device in a 1:1 or 1:2 setting.
Materials Required
Resources Needed Per Student:
- Student Data Sheet (Optional)
- Computer/Tablet
- Internet Access
- Link to El Niño Southern Oscillation Interactive
Directions
- Using an internet accessible device, students open the link to the El Niño Southern Oscillation Interactive to begin their exploration of this phenomenon.
- Distribute the Student Data Sheet (optional). Have students navigate on their own through the interactive model to answer the questions and complete the activities on their student sheet.

Disciplinary Core Ideas:
- ESS2A: Earth Materials and Systems
- ESS2C: The Role of Water in Earth’s Surface Processes
- ESS2D: Weather and Climate
Crosscutting Concepts:
- Patterns
- Systems and System Models
Science and Engineering Practices:
- Developing and Using Models
- Analyzing and Interpreting Data
- Constructing Explanations and Designing Solutions
- Students will learn some important indicators of El Niño and La Niña years by viewing maps and animations of sea surface temperature.
- Students will analyze data, identify patterns, and learn about anomalies.
- Students will make a prediction.
- One-to-One (tablet, laptop, or CPU)
- One-to-a-Group
Complementary Mini Lessons

Interactive Files

Grade Band
- 3-5
- 6-8
- 9-12
Time
- 15 minutes
Visualization Tool
NGSS Three Dimensional Learning
- See drop-down menu at the bottom of the page

