El Niño Southern Oscillation

If you want to understand how interconnected our planet is—how patterns and events in one place can affect life half a world away—study El Niño.
Episodic shifts in winds and water currents across the equatorial Pacific can cause floods in the South American desert while stalling and drying up the monsoon in Indonesia and India. Atmospheric circulation patterns that promote hurricanes and typhoons in the Pacific can also knock them down over the Atlantic. Fish populations in one part of the ocean might crash, while others thrive and spread well beyond their usual territory.
During an El Niño event, the surface waters in the central and eastern Pacific Ocean become significantly warmer than usual. That change is intimately tied to the atmosphere and to the winds blowing over the vast Pacific. Easterly trade winds (which blow from the Americas toward Asia) falter and can even turn around into westerlies. This allows great masses of warm water to slosh from the western Pacific toward the Americas. It also reduces the upwelling of cooler, nutrient-rich waters from the deep—shutting down or reversing ocean currents along the equator and along the west coast of South and Central America.
The circulation of the air above the tropical Pacific Ocean responds to this tremendous redistribution of ocean heat. The typically strong high-pressure systems of the eastern Pacific weaken, thus changing the balance of atmospheric pressure across the eastern, central, and western Pacific. While easterly winds tend to be dry and steady, Pacific westerlies tend to come in bursts of warmer, moister air.
Because of the vastness of the Pacific basin—covering one-third of the planet—these wind and humidity changes get transmitted around the world, disrupting circulation patterns such as jet streams (strong upper-level winds). We know these large-scale shifts in Pacific winds and waters initiate El Niño. What we don't know is what triggers the shift. This remains a scientific mystery.

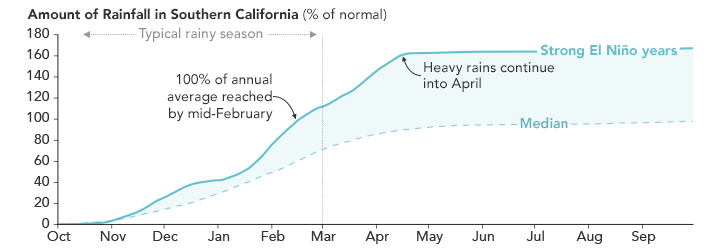
What is not a mystery is that El Niño is one of the most important weather-producing phenomena on Earth, a "master weather-maker," as author Madeleine Nash once called it. The changing ocean conditions disrupt weather patterns and marine fisheries along the west coasts of the Americas. Dry regions of Peru, Chile, Mexico, and the southwestern United States are often deluged with rain and snow, and barren deserts have been known to explode in flowers. Meanwhile, wetter regions of the Brazilian Amazon and the northeastern United States often plunge into months-long droughts.
El Niño events occur roughly every two to seven years, as the warm cycle alternates irregularly with its sibling La Niña—a cooling pattern in the eastern Pacific—and with neutral conditions. El Niño typically peaks between November and January, though the buildup can be spotted months in advance and its effects can take months to propagate around the world.
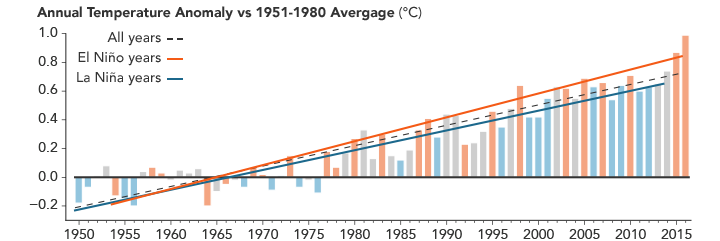
Though El Niño is not caused by climate change, it often produces some of the hottest years on record because of the vast amount of heat that rises from Pacific waters into the overlying atmosphere. Major El Niño events—such as 1972-73, 1982-83, 1997-98, and 2015-16—have provoked some of the great floods, droughts, forest fires, and coral bleaching events of the past half-century.
NASA, the National Oceanic and Atmospheric Administration (NOAA), and other scientific institutions track and study El Niño in many ways. From underwater floats that measure conditions in the depths of the Pacific to satellites that observe sea surface heights and the winds high above it, scientists now have many tools to dissect this l'enfant terrible of weather. The data visualizations on the next page show most of the key ways that we observe El Niño before, during, and after its visits.
Underwater Temperatures and Water Masses
The ocean is not uniform. Temperatures, salinity, and other characteristics vary in three dimensions, from north to south, east to west, and from the surface to the depths. With its own forms of underwater weather, the seas have fronts and circulation patterns that move heat and nutrients around ocean basins. Changes near the surface often start with changes in the depths.
The tropical Pacific receives more sunlight than any other region on Earth, and much of this energy is stored in the ocean as heat. Under neutral, normal conditions, the waters off southeast Asia and Australia are warmer and sea level stands higher than in the eastern Pacific; this warm water is pushed west and held there by easterly trade winds.
Temperature anomalies in the ocean depths reveal the fingerprints of El Niño and the La Niña that follows. (NASA Earth Observatory visualization by Joshua Stevens, using data from the Global Data and Assimilation Office.)
But as an El Niño pattern develops and trade winds weaken, gravity causes the warm water to move east. This mass, referred to as the "western Pacific warm pool," extends down to about 200 meters in depth, a phenomenon that can be observed by moored or floating instruments in the ocean: satellite-tracked drifting buoys, moorings, gliders, and Argo floats that cycle from the ocean surface to great depths. These in situ instruments (more than 3,000 of them) record temperatures and other traits in the top 300 meters of the global ocean.
The visualization above shows a cross-section of the Pacific Ocean from January 2015 through December 2016. It shows temperature anomalies; that is, how much the temperatures at the surface and in the depths ranged above or below the long-term averages. Note the warm water in the depths starting to move from west to east after March 2015 and peaking near the end of 2015. (The western Pacific grows cooler than normal.) By March 2016, cooler water begins moving east, sparking a mild La Niña in the eastern Pacific late in 2016, while the western Pacific begins to warm again.
Sea Surface Temperatures
For hundreds of years, the temperature near the water surface has been measured by instruments on ships, moorings and, more recently, drifters. Since the late 1970s, satellites have provided a global view of ocean surface temperatures, filling in the gaps between those singular points where floating measurements can be made.
Sea surface temperatures are measured from space by radiometers, which detect the electromagnetic energy (mostly light and heat) emitted by objects and surfaces on Earth. In the case of the oceans, satellite radiometers—such as the Advanced Very High Resolution Radiometer (AVHRR) on NOAA weather satellites and the Moderate Resolution Imaging Spectroradiometer (MODIS) on NASA's Terra and Aqua satellites—detect the strength of infrared and microwave emissions from the top few millimeters of the water.
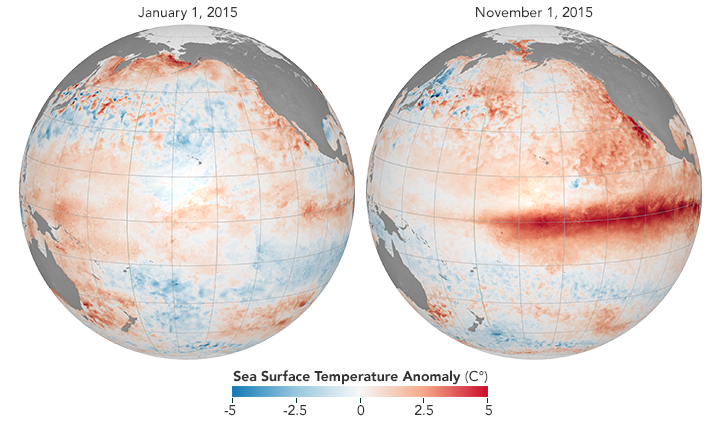
The maps above show sea surface temperature anomalies in the Pacific from winter and fall of 2015. The maps do not depict absolute temperatures; instead, they show how much above (red) or below (blue) the surface water temperatures were compared to a long-term (30-year) average. The maps were built with data from a multi-satellite analysis assembled by researchers from NOAA, NASA, and the University of South Florida.
When deciding whether the Pacific is in an El Niño state, the climatologists at NOAA examine sea surface temperatures in the east-central tropical Pacific—referred to as the Niño 3.4 region (between 120° to 170° West). An El Niño is declared when the average temperature stays more than 0.5 degrees Celsius above the long-term average for five consecutive months. In 1997-98 and 2015-16, sea surface temperatures rose more than 2.5 degrees Celsius (4.5 degrees Fahrenheit) above the average.
Sea Surface Height
Sea level is naturally higher in the western Pacific; in fact, it is normally about 40 to 50 centimeters (15-20 inches) higher near Indonesia than off of Ecuador. Some of this difference is due to tropical trade winds, which predominantly blow from east to west across the Pacific Ocean, piling up water near Asia and Oceania. Some of it is also due to the heat stored in the water, so measuring the height of the sea surface is a good proxy for measuring the heat content of the water.
The animation above compares sea surface heights in the Pacific Ocean as measured by the altimeter on the OSTM/Jason-2 satellite and analyzed by scientists at NASA’s Jet Propulsion Laboratory. It shows sea surface height anomalies, or how much the water stood above or below its normal sea level. Shades of red indicate where the ocean was higher because warmer water expands to fill more volume (thermal expansion). Shades of blue show where sea level and temperatures were lower than average (water contraction). Normal sea-level conditions appear in white.
As you watch sea surface heights change through 2015, note the pulses of warmer water moving east across the ocean. When the trade winds ease and bursts of wind come out of the west, warm water from the western Pacific pulses east in vast, deep waves (Kelvin waves) that even out sea level a bit. As the warm water piles up in the east, it deepens the warm surface layer, lowering the thermocline and suppressing the natural upwelling that usually keeps waters cooler along the Pacific coasts of the Americas. (Look back at the underwater temperature animation to see this phenomenon.)
Ocean Color
As temperatures change due to El Niño, other effects ripple through the ocean. In the eastern Pacific, the surge of warm water deepens the thermocline, the thin layer that separates surface waters from deep-ocean waters. This thicker layer of warm water at the surface curtails the usual upwelling of cooler, nutrient-rich water—the water that usually supports rich fisheries in the region. This loss of the nutrient supply is evident in declining concentrations of sea surface chlorophyll, the green pigment present in most phytoplankton. Changes in water properties such as oxygen and carbon content also affect marine life.
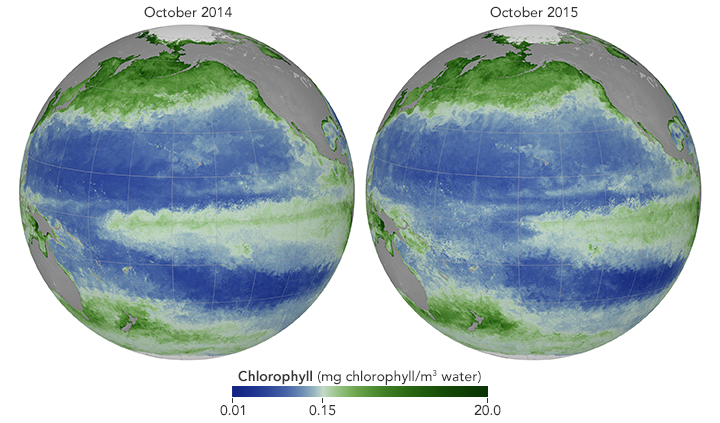
The images above compare sea surface chlorophyll in the Pacific Ocean as observed in October 2014 and 2015. Shades of green indicate more chlorophyll and blooming phytoplankton. Shades of blue indicate less chlorophyll and less phytoplankton. (For a larger view of these maps, click here.)
Historic observations have shown that with less phytoplankton available, the fish that feed upon plankton—and the bigger fish that feed on the little ones—have a greatly reduced food supply. In most extreme El Niños, the decline in fish stocks has led to famine and dramatic population declines for marine animals such as Galapagos penguins, marine iguanas, sea lions, and seals.
Surface Winds
The behavior of the winds and waters are tightly intertwined in the Pacific basin during an El Niño event. "It is like the proverbial chicken-and-egg problem," says Michael McPhaden of NOAA’s Pacific Marine Environmental Laboratory. “During an El Niño year, weakening winds along the equator lead to warming water surface temperatures that lead to further weakening of the winds.”
The image below shows the dominant direction of the winds and changes in their intensity near the ocean surface as observed by NASA’s RapidScat instrument. Arrows show how the primary wind direction changed from January 2015 to January 2016. The change in wind speed is represented by colors, with surface wind speeds increasing in teal-green areas and decreasing in purple areas.
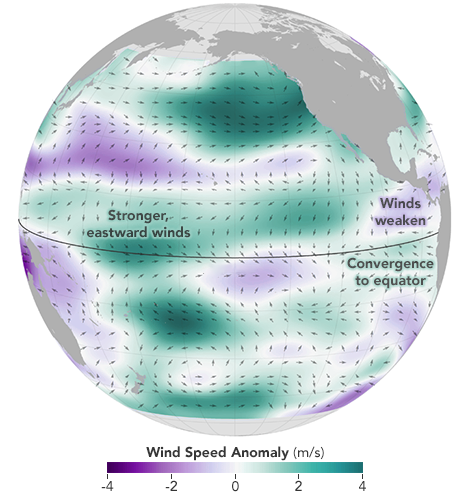
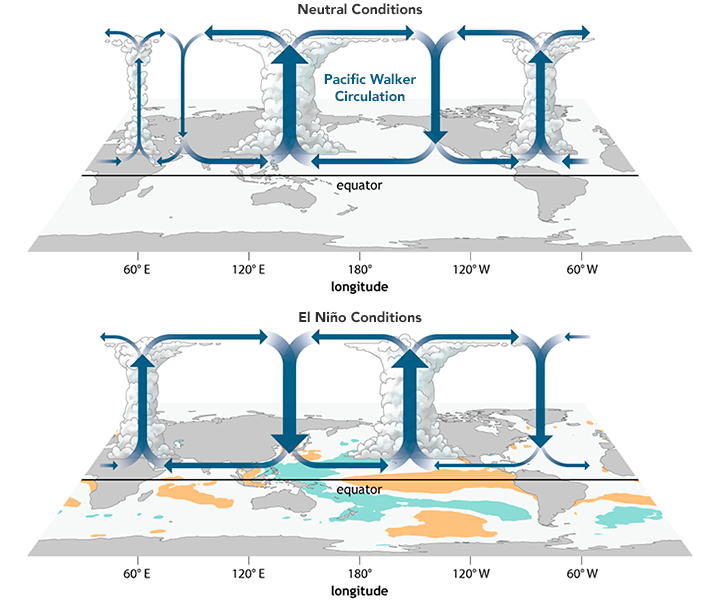
The El Niño signal is evident in the eastward-blowing winds in the tropical western and central Pacific. Winds near the equator (5° North to 5° South) blew more forcefully from west to east in the western and central Pacific; meanwhile, the easterly (east to west) trade winds weakened near the Americas. These wind shifts allowed pulses of warm water to slosh from Asia toward the Americas over the course of 2015. The signal also shows up in a convergence in the eastern Pacific; that is, the winds in the tropics (23°N to 23°S) were generally moving toward the equator. This reflects intense convection, where warm surface waters promote intense evaporation and rising air. (See the Walker circulation illustration.) Consequently, new air masses move toward the equator to replace the rising air.
Other changes occurred well away from the equator; scientists refer to these as teleconnections. For instance, RapidScat detected a strong clockwise-rotating (anti-cyclonic) wind anomaly in the northeastern Pacific that may have been the result of stronger-than-normal atmospheric circulation (Hadley cell). That is, air that rose above the super-heated waters of the central tropical Pacific sank back to the surface at higher latitudes with more than usual intensity.
Cloudiness and Precipitation
By changing the distribution of heat and wind across the Pacific, El Niño alters rainfall patterns for months to seasons. As the warm ocean surface warms the atmosphere above it, moisture-rich air rises and develops into rain clouds. So while the majority of precipitation tends to occur over the west Pacific warm pool in neutral years, much more develops over the central and eastern Pacific during an El Niño event.
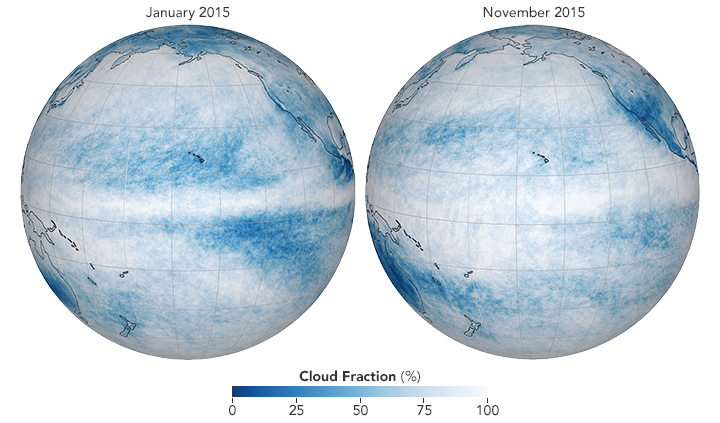
The globes show cloud fraction over the Pacific Ocean in January and November 2015 as measured by the MODIS instrument on NASA's Aqua satellite. The data show how often and how much the sky was filled with clouds over a particular region. Cloudiness is a result of moisture rising from the ocean surface into the atmosphere. During an El Niño (November image), cloud cover increases in the eastern Pacific due to the warm water releasing more moisture and heat into the atmosphere. Those clouds can lead to more rain, but they also shade the water by day and trap heat near the surface at night.