GLOBE Connections
GLOBE Hydrosphere Protocols & Related ESDE Datasets

My NASA Data features resources for GLOBE protocols that provide connections to NASA datasets in the Earth System Data Explorer, as well as background information for the protocol, student data sheets, and related learning activities. For more information on GLOBE or Hydrosphere protocols see the resources at the bottom of the page. It is important to note that a particular protocol may support more than one phenomenon and may support phenomena from different spheres. To see how individual protocols relate to a particular phenomenon, you can visit the GLOBE Connection for that phenomenon (i.e., Sea Level Rise, El Niño Southern Oscillation, Ocean Circulation Patterns, etc.)
Related Earth System Data Explorer datasets:
The datasets in My NASA Data's Earth System Data Explorer which supplement exploration of each protocol are also indicated. These supplemental datasets may measure the same variable or related variables, and they may have a different temporal scale. Specific research questions may also have additional supporting datasets which can be explored. All data available through My NASA Data can be found on the Data Collections: Earth System Data Explorer page.
Explore the MND GLOBE Connections Datasets spreadsheet to review the range of Hydrospheric datasets in the Earth System Data Explorer by visiting this link.
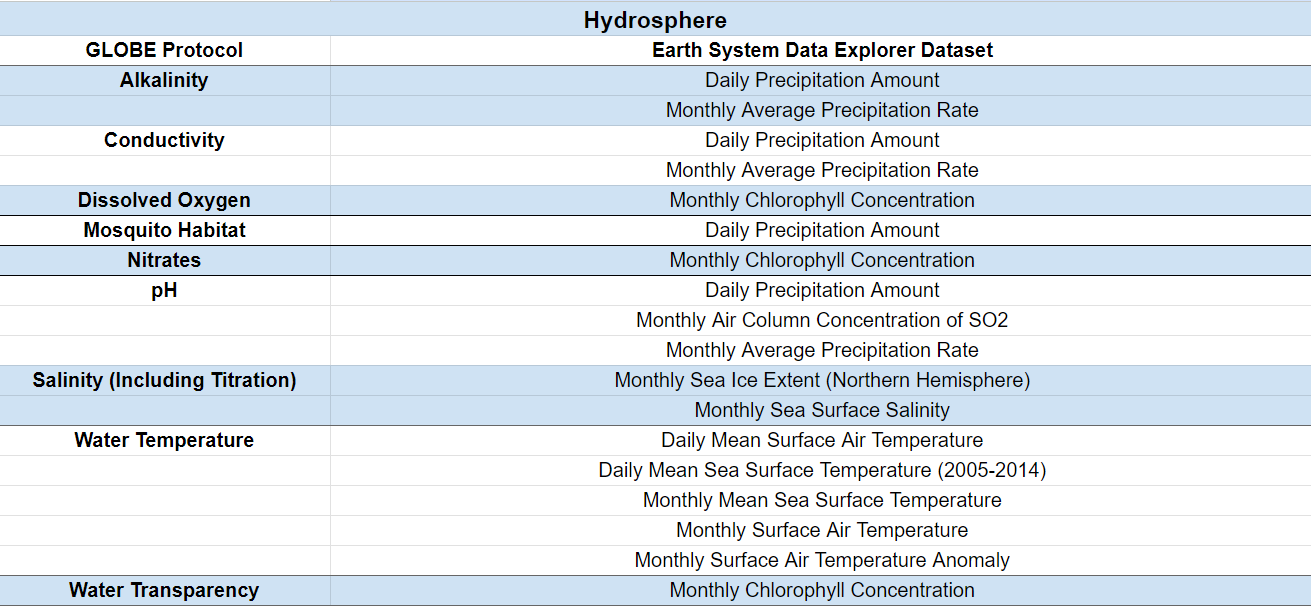
The GLOBE Hydrosphere protocols related to phenomena or datasets supported by My NASA Data (MND) are outlined below. Under each protocol, there is a list of related Earth System Data Explorer datasets.
Alkalinity
- Daily Precipitation Amount
- Monthly Average Precipitation Rate
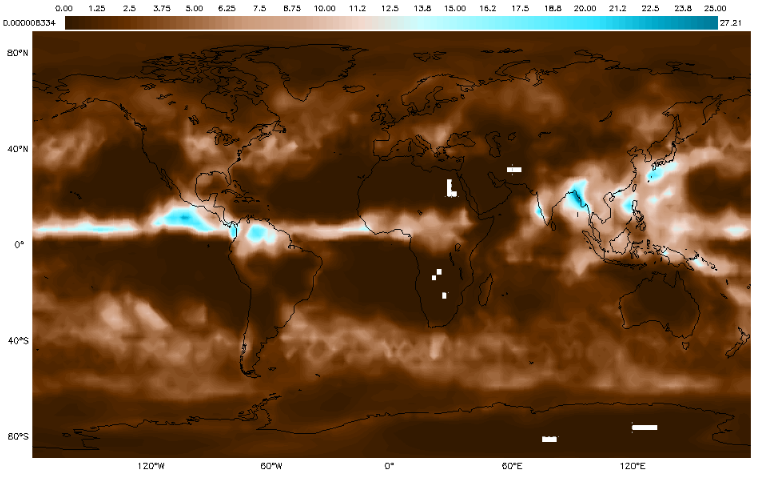
Monthly Precipitation - June 2018
Students can investigate whether or not precipitation and soil moisture are related to the alkalinity of water in an area.
Conductivity
- Daily Precipitation Amount
- Monthly Average Precipitation Rate
Students can investigate whether or not precipitation and soil moisture are related to the alkalinity of water in an area.
Dissolved Oxygen
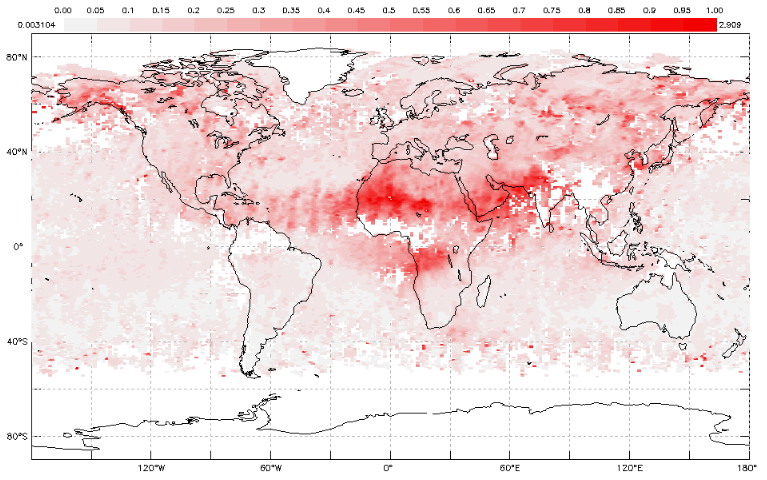
- Monthly Chlorophyll Concentration
Chlorophyll levels are related to dissolved oxygen in the water.
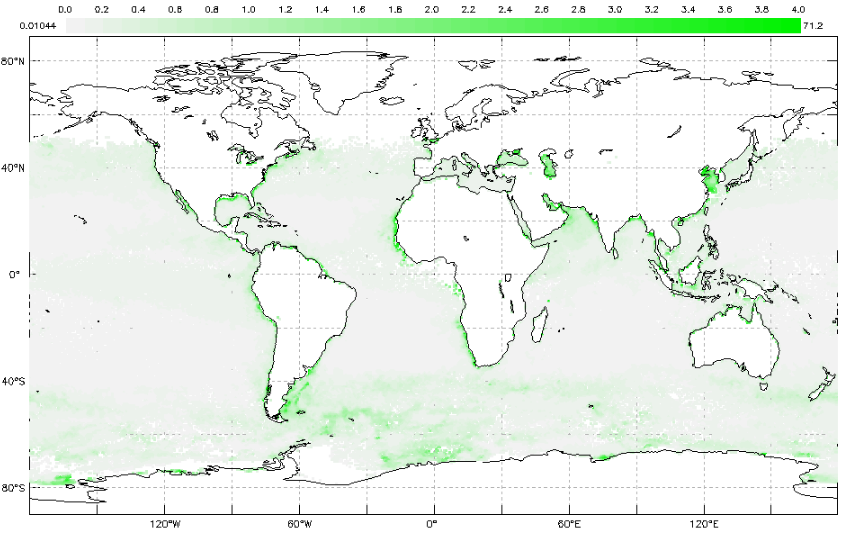
Monthly Chlorophyll Concentration - January 2019
Mosquito Habitat
- See the Mosquito Protocol Bundle
Nitrates
- Monthly Chlorophyll Concentration
Chlorophyll levels are related to the nutrient content in the water.
pH
- Monthly Air Column Concentration of SO2
- Daily Precipitation Amount
- Monthly Average Precipitation Rate
See how soil moisture and precipitation can impact the pH of water. Sulfate aerosols make rain acidic (acid rain) when they rain out of the atmosphere.
Salinity (Including Titration)
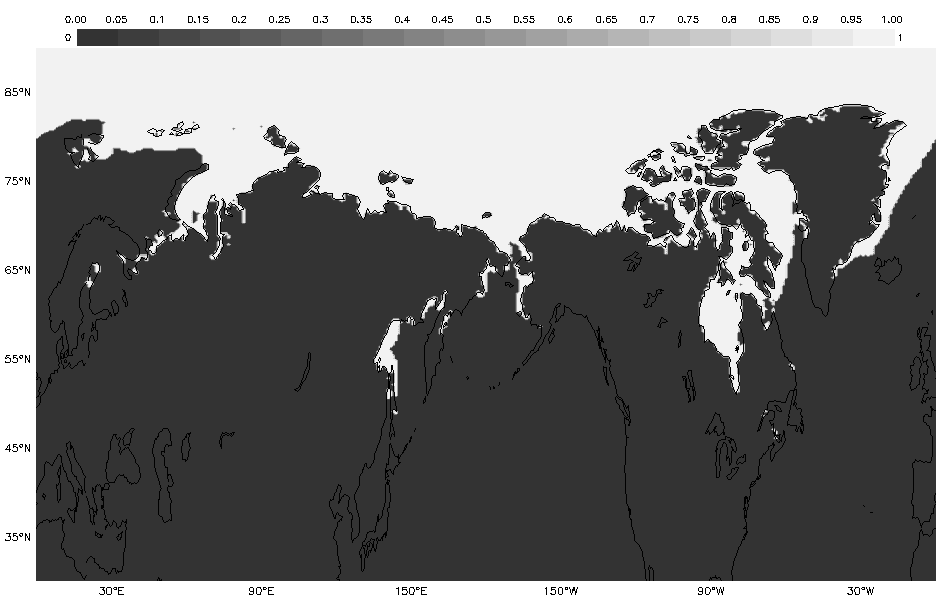
- Monthly Sea Ice Extent (Northern Hemisphere)
- Monthly Sea Surface Salinity
These data show the monthly average sea ice extent across the Northern Hemisphere. The areas in white are where ice is at least partially covering the ocean surface (at least 15% coverage). The formation of sea ice greatly increases the salinity and density of the water at remaining at the surface of the ocean, causing the water to sink. This action helps drive the global thermohaline circulation, an important circulation in the climate system. The formation of sea ice also greatly increases the surface albedo.
Water Temperature
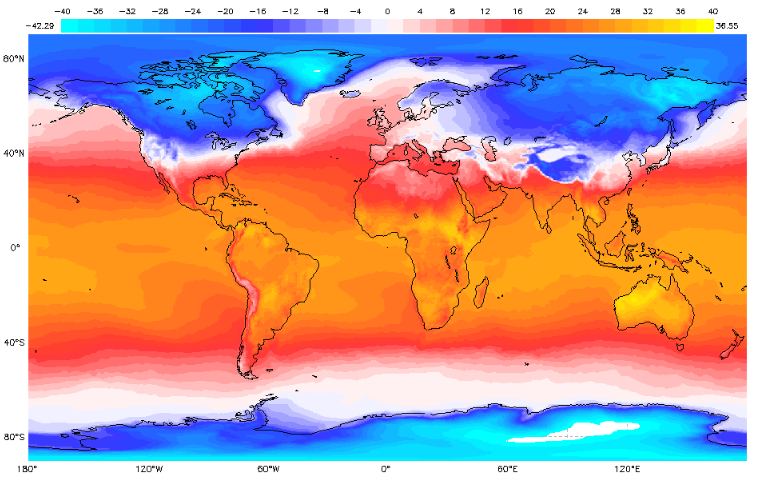
- Daily Mean Surface Air Temperature
- Daily Mean Sea Surface Temperature (2005-2014)
- Monthly Mean Sea Surface Temperature
- Monthly Surface Air Temperature
- Monthly Surface Air Temperature Anomaly
These temperature datasets allow students to explore monthly temperature averages for air and the Earth's surface. They can also investigate relationships between water temperature, air temperature, and surface temperatures.
Water Transparency
- Monthly Chlorophyll Concentration
Chlorophyll can be an indicator of the presence of phytoplankton which are one factor that can affect transparency
GLOBE Hydrosphere Protocol Information
GLOBE Hydrosphere protocols can be found on the GLOBE website. Each GLOBE protocol page will have information for the protocol, data sheets, and related learning activities. Online e-Training is available.
GLOBE Protocol Bundles
Protocol bundles are designed to use related protocols from different spheres to investigate different topics. The following protocol bundles include at least one atmosphere protocol. The GLOBE protocol bundles can be found on the GLOBE website.
Visit the following links to explore the Earth System Data Explorer datasets that may be used to support students who are exploring their communities using the GLOBE protocol bundles.