Lesson Plans
Instructional Videos for GLOBE Earth System Poster: Lesson Plan
Overview
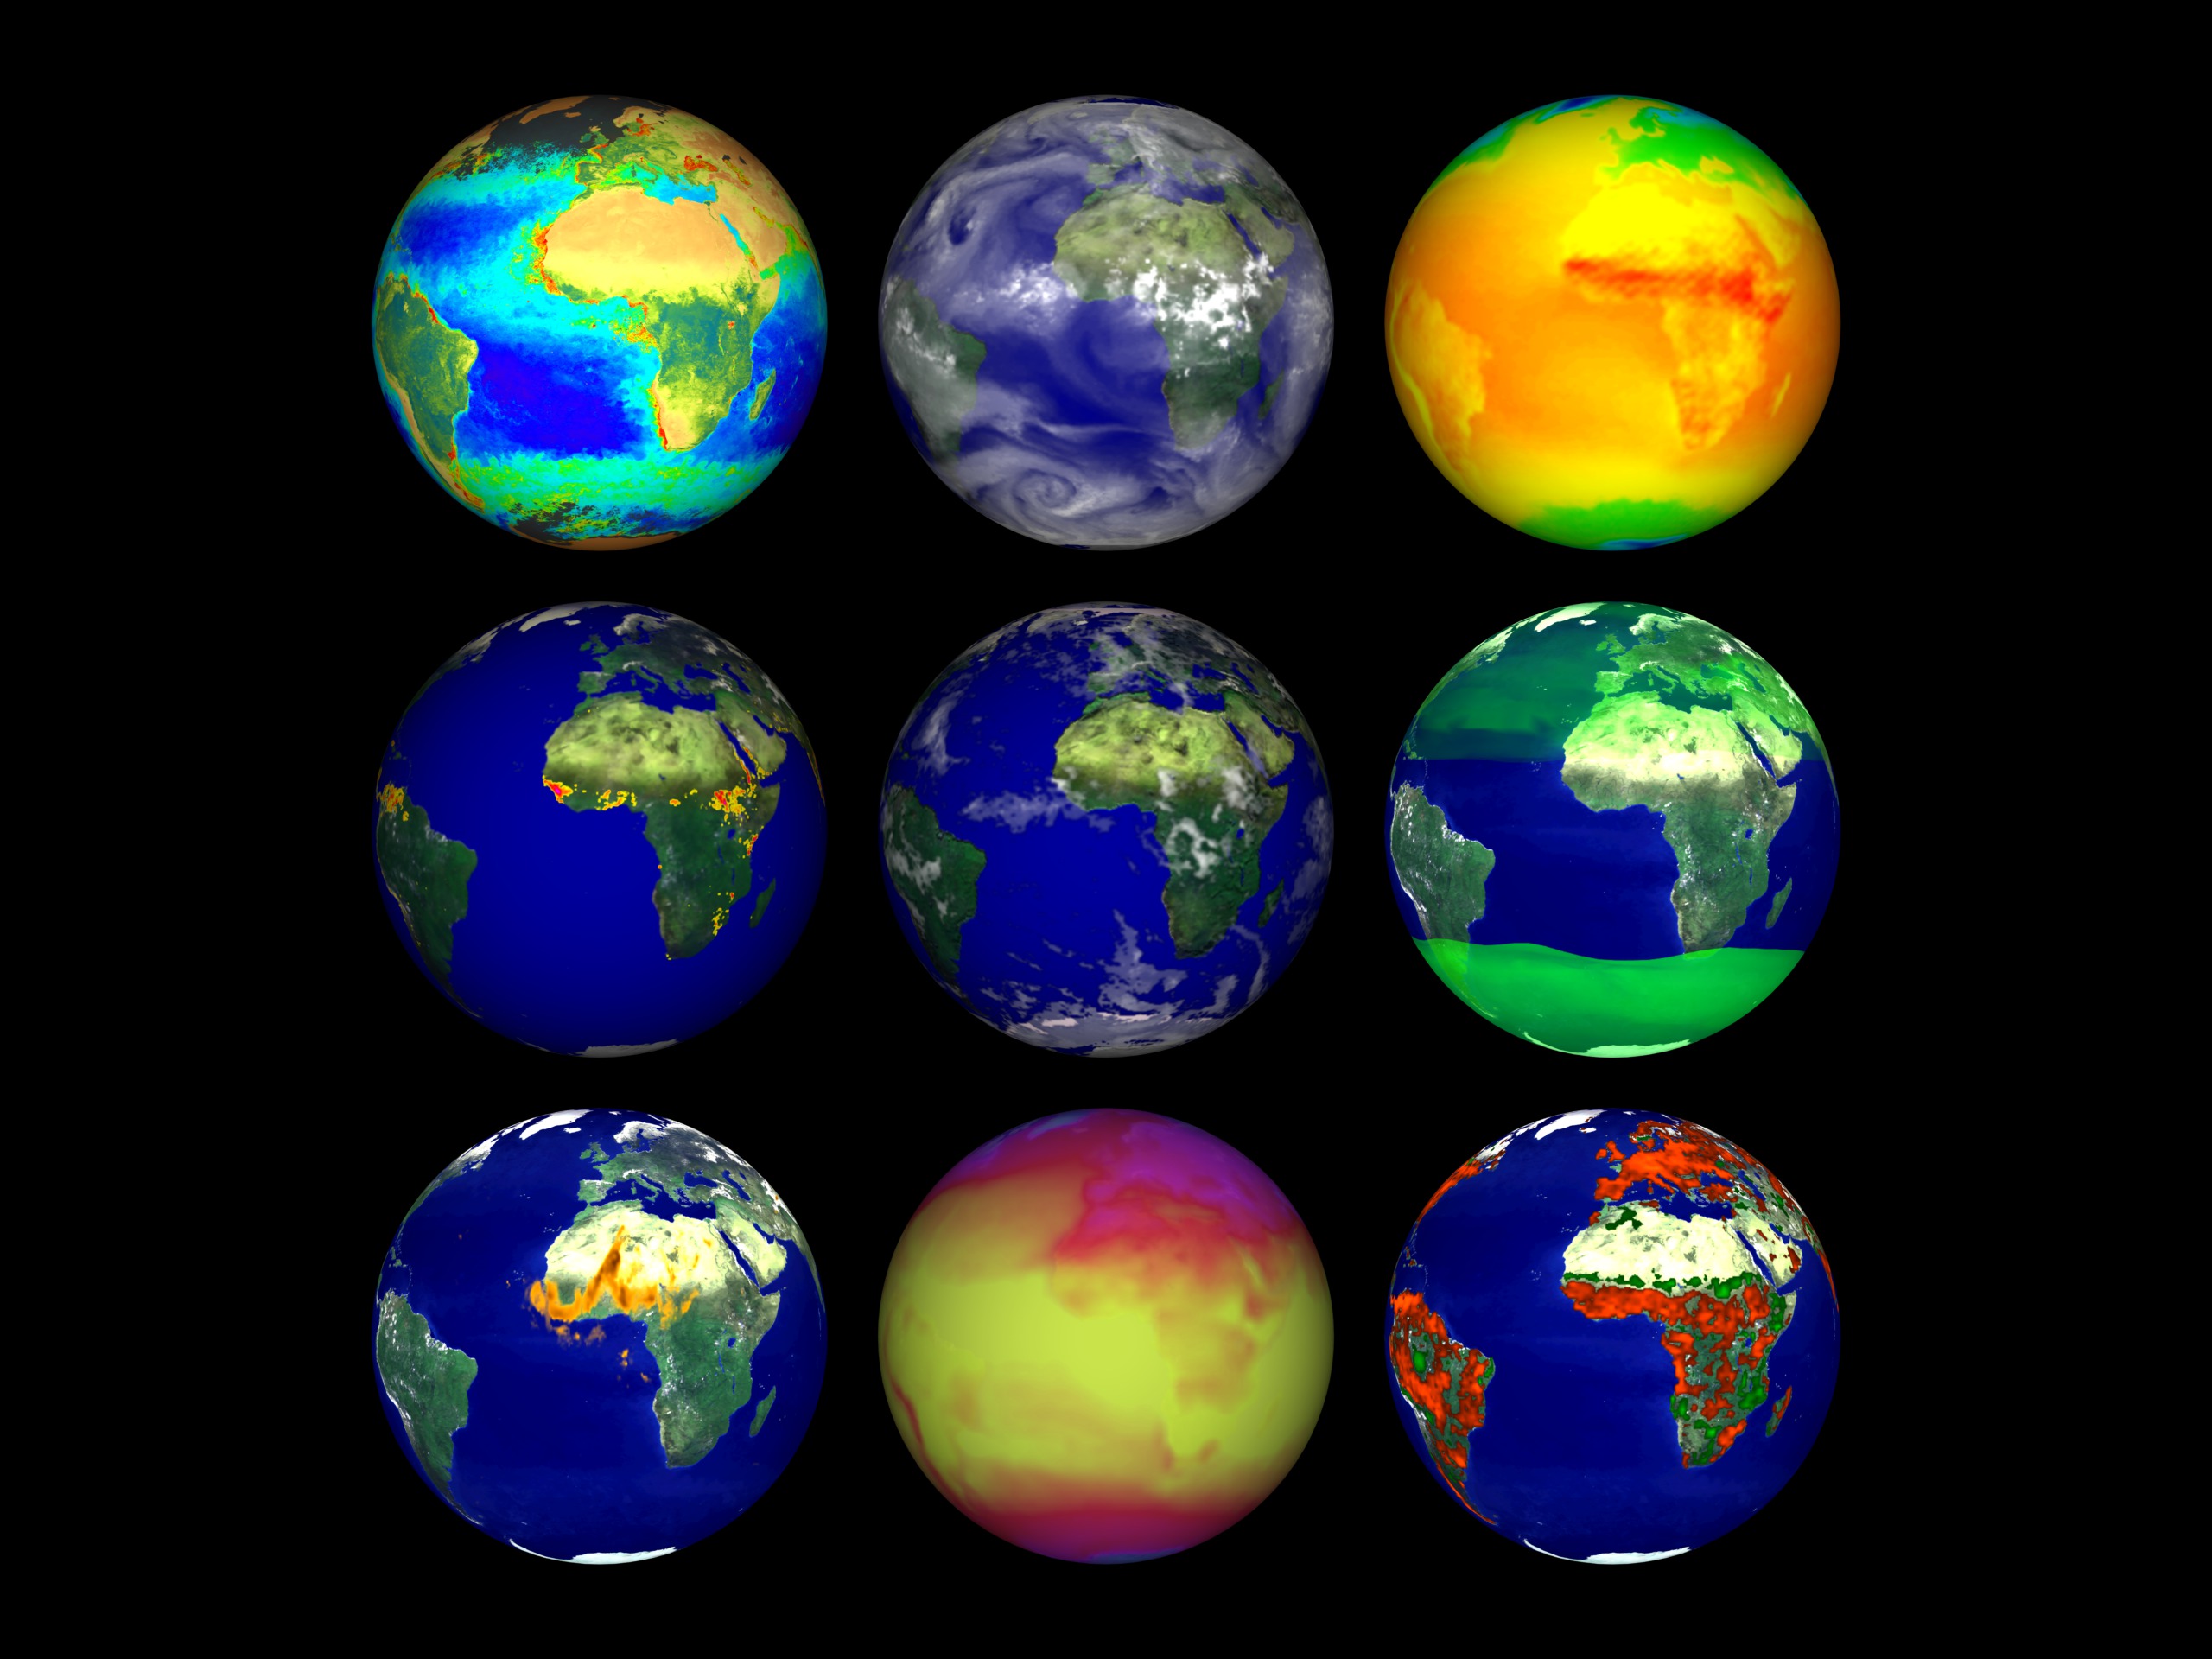
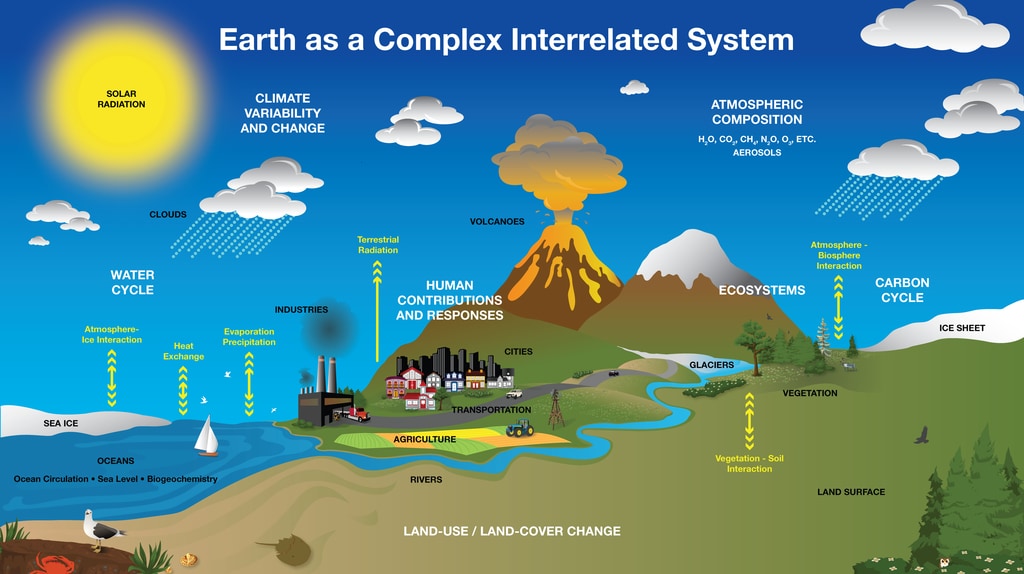
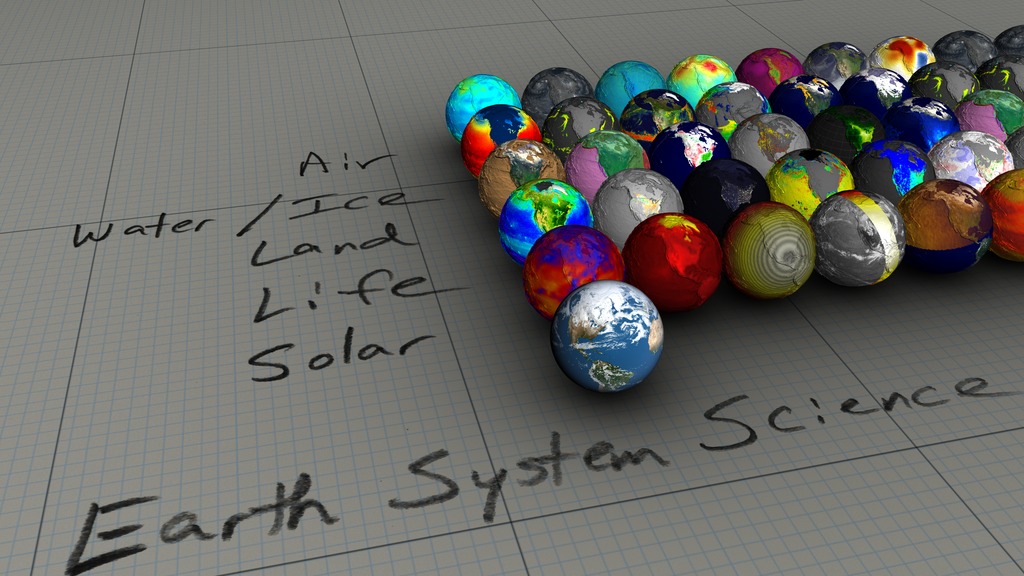
The Earth System Poster activity walks learners through global patterns and illuminates how each of the spheres is interconnected across the world. We will divide into small groups to look at maps of different parts of the earth system that have been observed by NASA satellites. We will start by examining a single map of a single variable being monitored from space, then look at how that variable changes through the year. We will put our variables together and investigate how they influence one another, and how they might shift with a rapidly changing Arctic climate.
Access all videos here.
Activity 1: Explore a single map
Focus Questions:
- What variable did you examine and what is the range of values shown on the scale bars?
- What interesting patterns did you observe for your focus region?
- Where in the world do you find the highest and lowest values (the extremes) of the data in your image? Why do you think these locations experience the extremes and not other locations?
- Are any patterns in the data noticeable? Are patterns different on different continents? Different over water than over land? Explain these patterns.
Activity 2: Exploring annual changes
Focus Questions:
- What changes do you see through the year? What explanations can you suggest for these patterns?
- Choose a location or region. During which months do the extreme highs and lows occur? What explanations can you suggest for the timing of those extremes?
- Which regions experience both the extreme highs and lows? which regions don’t experience the extremes? Why do you think this happens?
- What differences, if any, do you find between the year’s variations over the oceans versus the year’s variations over the continents?
- Are there regions that remain relatively unchanged over the year? Why do you think this happens?
Activity 3: Explore Relationships Between Two Variables
Focus Questions:
- What relationship do you see between the two variables?
- Do the relationships appear to be directly or inversely proportional? Explain.
Activity 4: Exploring relationships among variables for a particular month
Focus Questions:
- Which regions experience the extreme highs and lows for each variable?
- Which regions don’t experience the extremes? Why do you think this occurs?
- What differences, if any, do you find between variations of variables over the oceans versus variations in variables over the continents? What amounts of insolation, surface temperature, cloud fraction, precipitation and aerosols characterize the world’s most vegetated regions for a particular month? Where is the greatest concentration of aerosols originating from and how would you characterize that particular environment based on the six images?
Activity 5: Exploring relationships among variables six months apart
Focus Questions:
- Which variables change the most over the six-month period? Which variables change the least?
- Why do you think this happens?
- Do you see any relationships among the variables that you didn’t see previously?
Supported NGSS Performance Expectations
- 5-ESS2-1: Develop a model using an example to describe ways the geosphere, biosphere, hydrosphere, and/or atmosphere interact.
- 4-ESS2-2: Analyze and interpret data from maps to describe patterns of Earth’s features.
- MS-ESS2-2: Construct an explanation based on evidence for how geoscience processes have changed Earth's surface at varying time and spatial scales.
- HS-ESS2-1: Develop a model to illustrate how Earth’s internal and surface processes operate at different spatial and temporal scales to form continental and ocean-floor features.
- HS-ESS2-2: Analyze geoscience data to make the claim that one change to Earth's surface can create feedbacks that cause changes to other Earth systems.
Activity Assessments and Extensions:
- Located in the GLOBE Earth System Poster teacher guide


Interactive Files
Time
- 90 minutes