GLOBE Connections
GLOBE Cryosphere-Related Protocols & ESDE Datasets

My NASA Data features resources for GLOBE protocols that provide connections to NASA datasets in the Earth System Data Explorer, as well as background information for the protocol, student data sheets, and related learning activities. For more information on GLOBE or cryosphere related protocols see the resources at the bottom of the page. It is important to note that a particular protocol may support more than one phenomenon and may support phenomena from different spheres. To see how individual protocols relate to a particular phenomenon, you can visit the GLOBE Connection for that phenomenon (i.e., Sea and Land Ice Melt, Changes in Snow and Ice Extent, Changing Albedo Values, etc.)
Related Earth System Data Explorer datasets:
The datasets in My NASA Data's Earth System Data Explorer which supplement exploration of each protocol are also indicated. These supplemental datasets may measure the same variable or related variables, and they may have a different temporal scale. Specific research questions may also have additional supporting datasets which can be explored. All data available through My NASA Data can be found on the Data Collections: Earth System Data Explorer page.
Explore the MND GLOBE Connections Datasets spreadsheet to review the range of Cryospheric datasets in the Earth System Data Explorer by visiting this link.
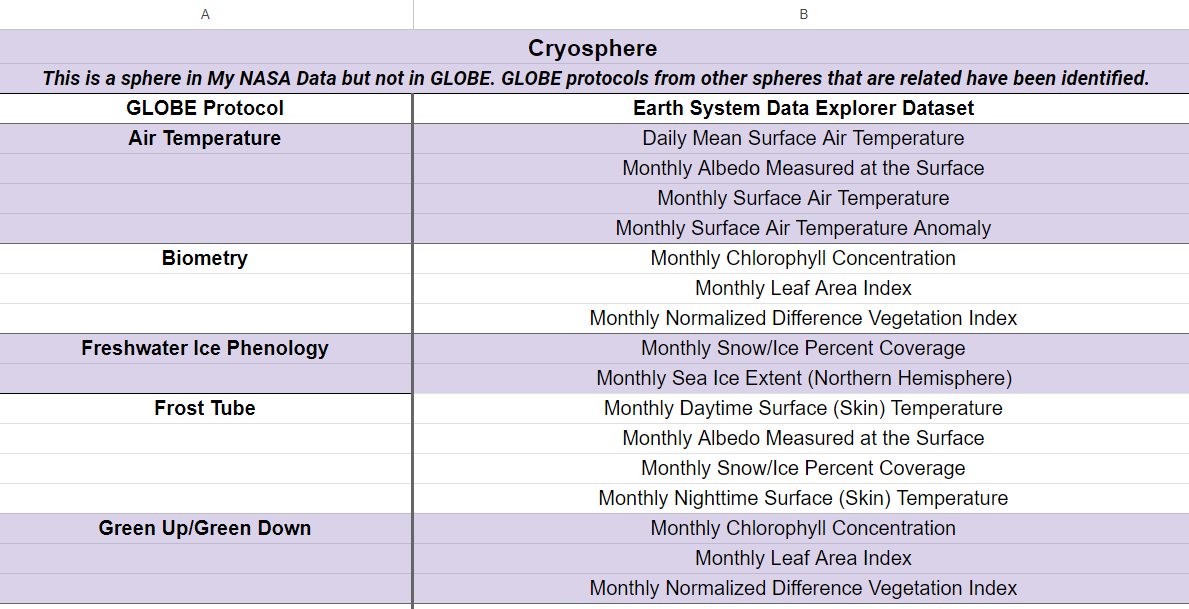
While GLOBE does not identify the cryosphere as a separate sphere as My NASA Data does, the GLOBE protocols related to cryosphere phenomena or datasets supported by My NASA Data are outlined below. Under each protocol, there is a list of related Earth System Data Explorer datasets.
Air Temperature
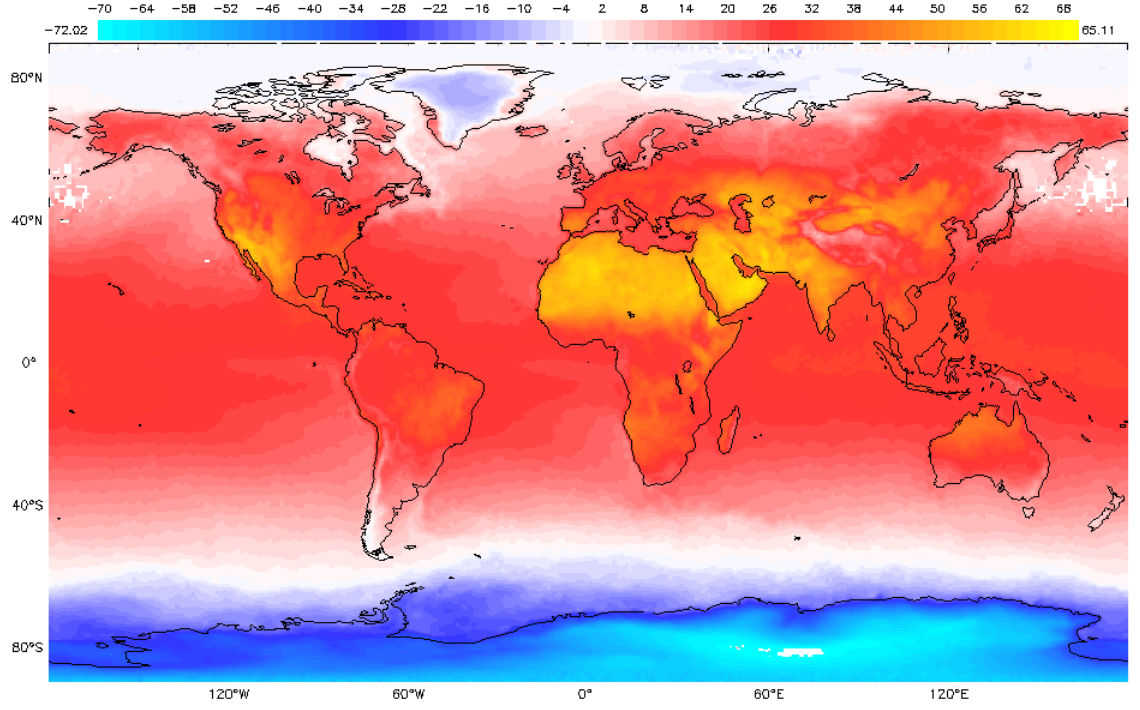
These temperature datasets allow students to explore daily and monthly temperature averages, as well as monthly air temperature anomalies to help put their own data in context.
- Daily Surface Air Temperature
- Monthly Albedo Measured at the Surface
- Monthly Surface Air Temperature
- Monthly Surface Air Temperature Anomaly
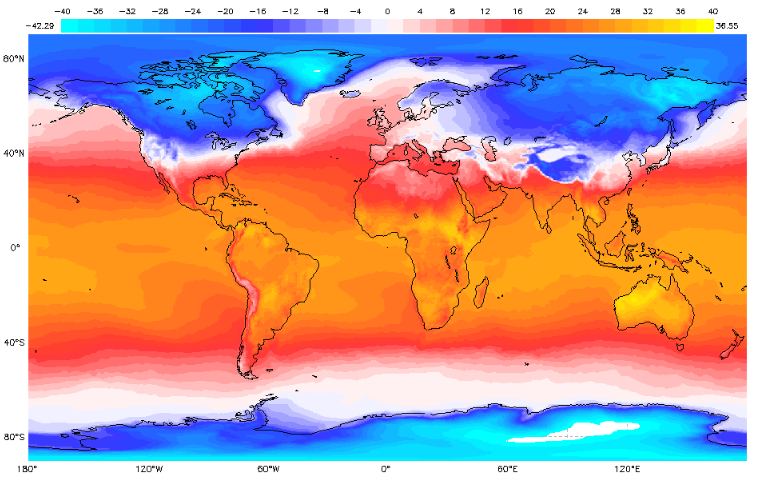
Monthly Surface Air Temperature - February 2019
Biometry
These datasets describe the amount of leaves present at each location on the map and an index that indicates the health of plants on Earth's surface. Changes in these data can indicate a response of the biosphere to changes in the cryosphere.
- Monthly Chlorophyll Concentration
- Monthly Leaf Area Index
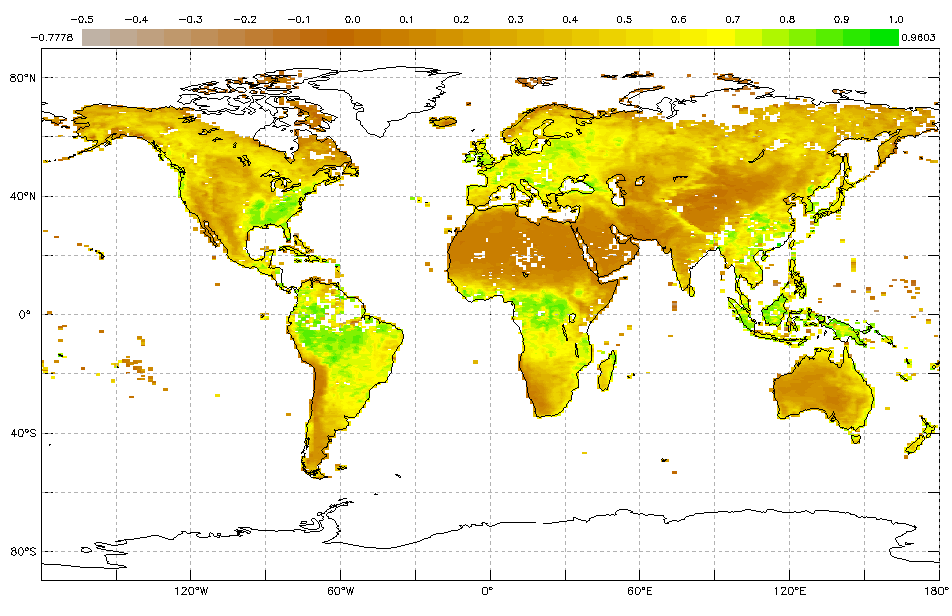
- Monthly Normalized Difference Vegetation Index
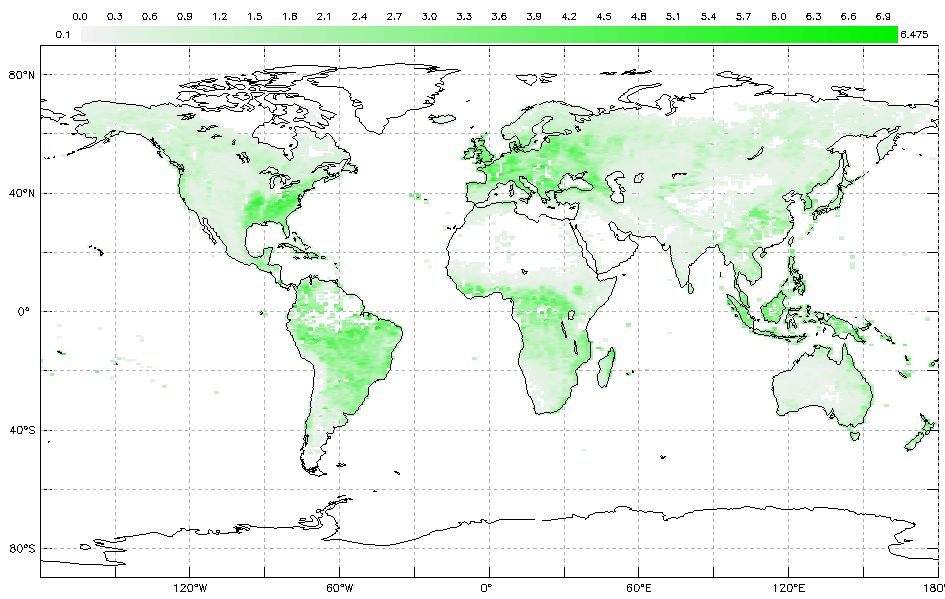
Monthly Leaf Area Index - May 2019
Freshwater Ice Phenology
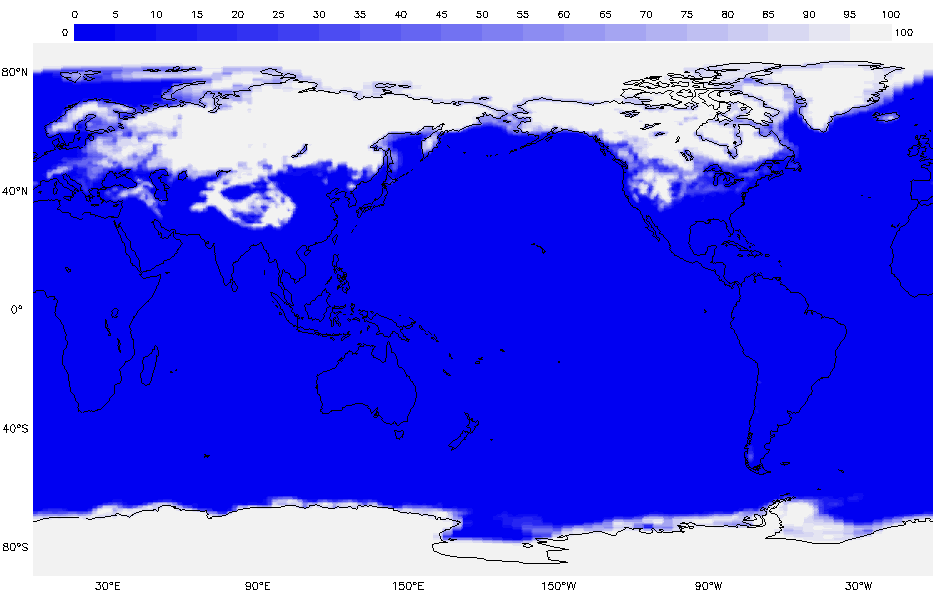
These data show the monthly average sea ice extent across the Northern Hemisphere. The are
as in white are where ice is at least partially covering the ocean surface (at least 15% coverage). The formation of sea ice greatly increases the salinity and density of the water at remaining at the surface of the ocean, causing the water to sink. This action helps drive the global thermohaline circulation, an important circulation in the climate system. The formation of sea ice also greatly increases the surface albedo.
- Monthly Snow/Ice Percent Coverage
- Monthly Sea Ice Extent (Northern Hemisphere)
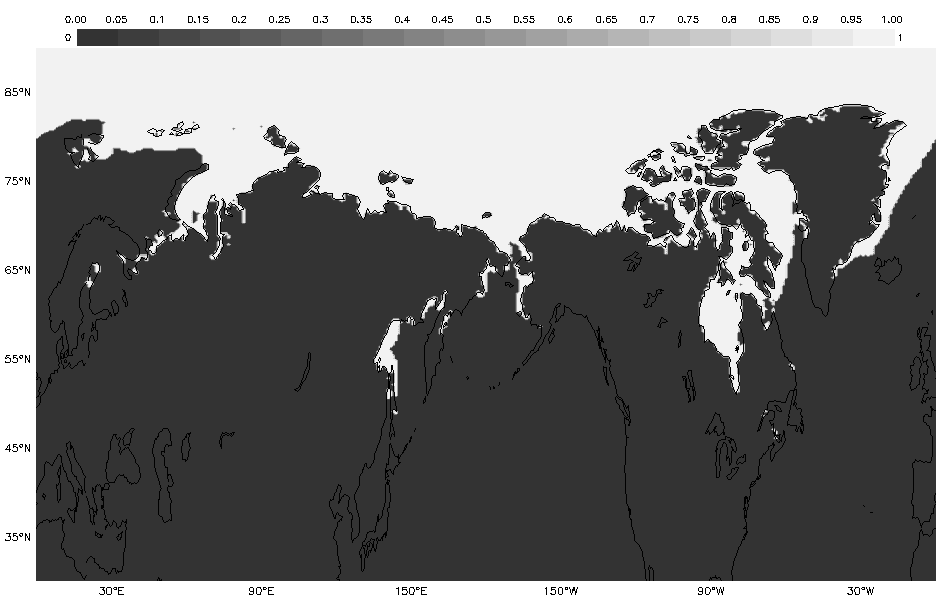
December 2017
Frost Tube
These data are related to soil moisture, which can include frozen moisture, albedo, surface temperatures and the percent coverage of snow and ice in each pixel, including snow, land ice, and sea ice. Changes in these data may be related to observed changes in frost tube data.
- Monthly Daytime Surface (Skin) Temperature
- Monthly Albedo Measured at the Surface
- Monthly Snow/Ice Percent Coverage
- Monthly Nighttime Surface (Skin) Temperature
Green Up/Green Down
These datasets describe the amount of leaves present at each location on the map and an index that indicates the health of plants on Earth's surface.
- Monthly Chlorophyll Concentration
- Monthly Leaf Area Index
- Monthly Normalized Difference Vegetation Index
Monthly Normalized Difference Vegetation Index - May 2019
Precipitation
Precipitation data are complemented by cloud data and water vapor data.
- Daily High Cloud Coverage
- Daily Low Cloud Coverage
- Daily Middle Cloud Coverage
- Daily Total Cloud Coverage
- Monthly Low Cloud Coverage
- Monthly Total Cloud Coverage
- Monthly Water Vapor in the Atmosphere
- Daily Precipitation Amount
- Monthly Average Precipitation Rate
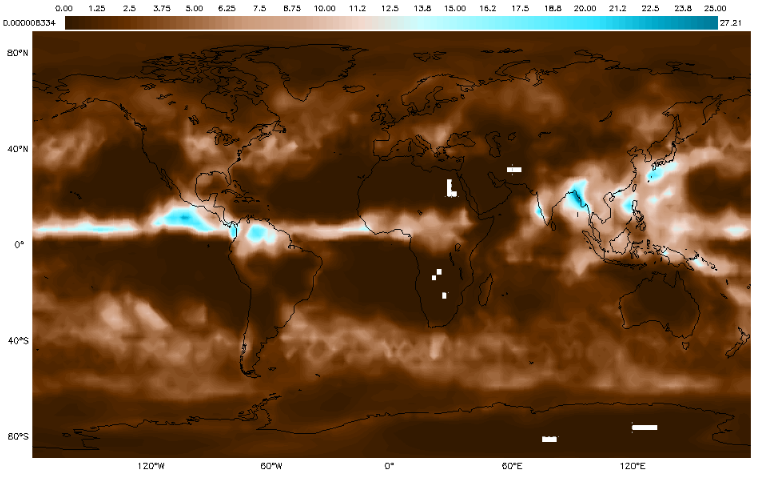
Monthly Precipitation - June 2018
Salinity (Including Titration)
Changes in sea surface temperature can lead to the formation or melt of sea ice which can impact salinity.
- Daily Mean Sea Surface Temperature (2005-2014)
- Monthly Mean Sea Surface Temperature
- Monthly Sea Surface Salinity
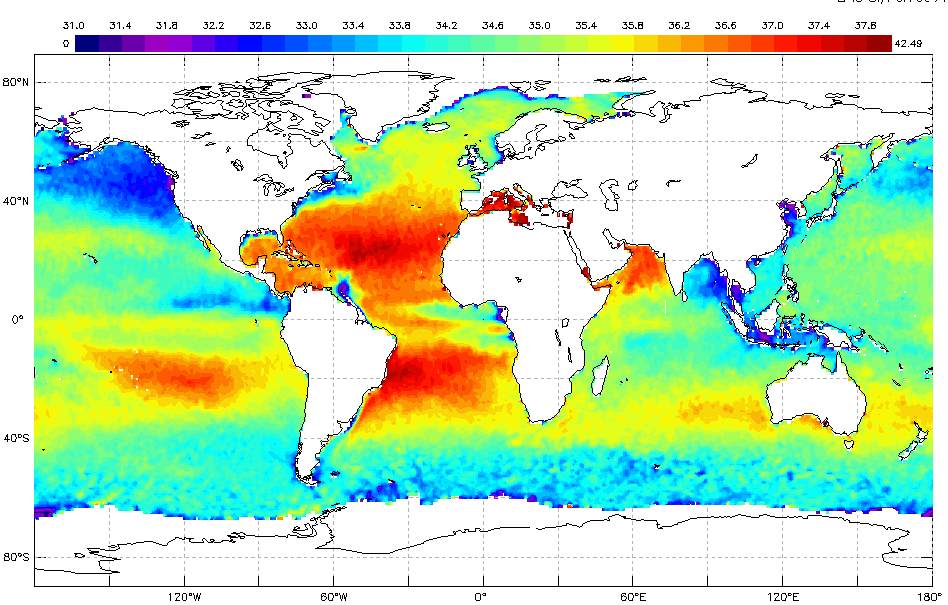
Monthly Sea Surface Salinity - May 2019
Solid Precipitation
This quantity measures the percent coverage of snow and ice in each pixel, including snow, land ice, and sea ice.
- Monthly Albedo Measured at the Surface
- Monthly Snow/Ice Percent Coverage
Snowboard Construction
This quantity measures the percent coverage of snow and ice in each pixel, including snow, land ice, and sea ice.
- Monthly Snow/Ice Percent Coverage
Monthly Snow/Ice Percent Coverage - January 2019
Surface Temperature
Skin temperature is surface temperature. Monthly daytime and nighttime skin temperature can be compared to student measurements.
- Monthly Daytime Surface (Skin) Temperature
- Monthly Albedo Measured at the Surface
- Monthly Nighttime Surface (Skin) Temperature
- Monthly Surface (Skin) Temperature
Monthly Daytime Skin Temperature - June 2019
GLOBE Cryosphere Related Protocols
GLOBE protocols can be found on the GLOBE website. Each GLOBE protocol page will have information for the protocol, data sheets, and related learning activities. Online e-Training is available.