Grade Level: 3-5
This lesson introduces the Earth system science spheres through model making and discussion.
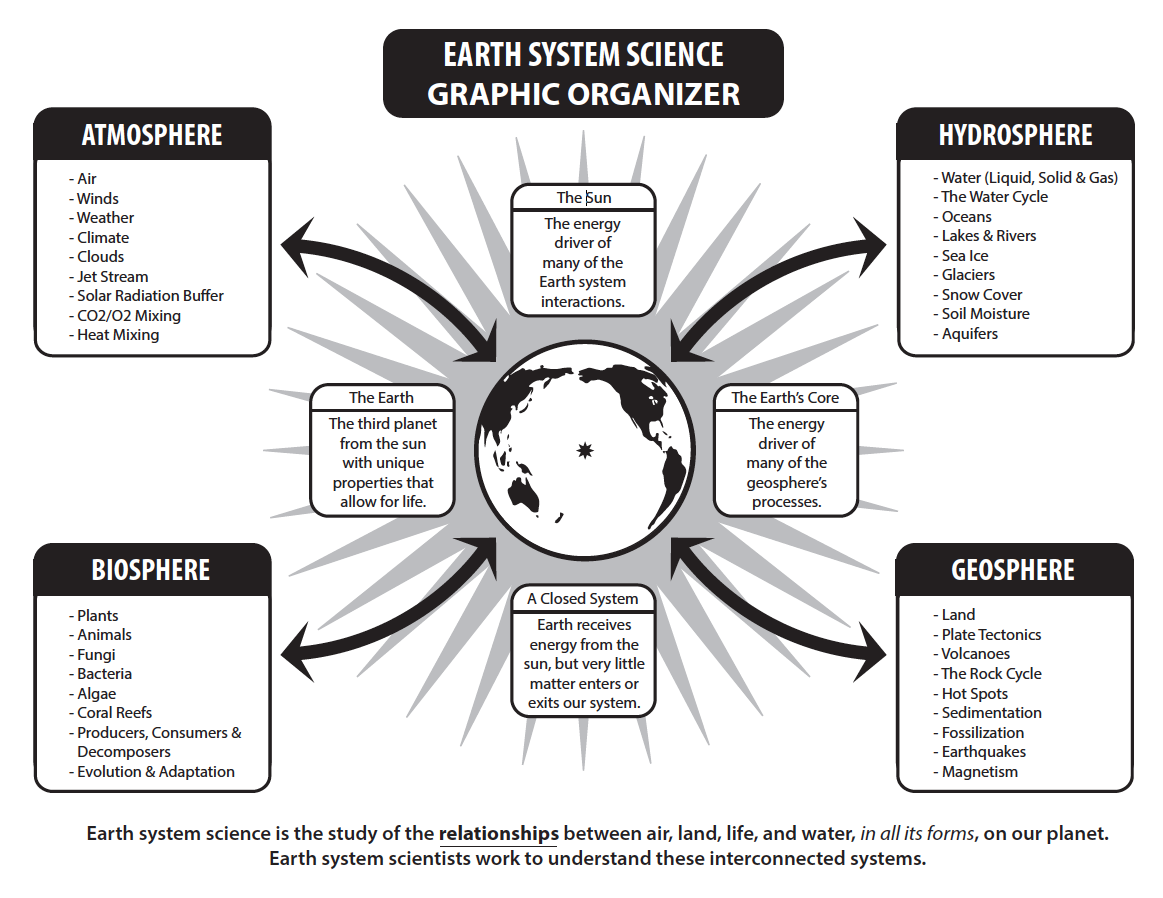
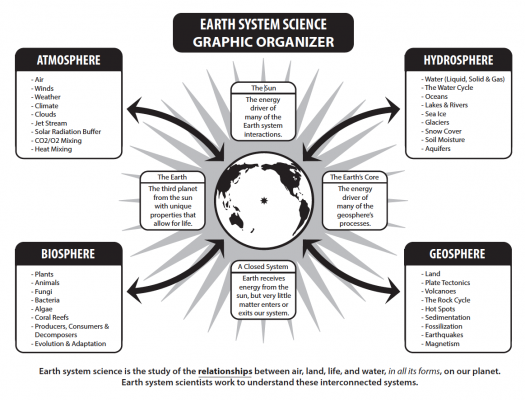
Any system within the Earth system is considered an open system. Because energy flows freely into and out of systems, all systems respond to inputs and, as a result, have outputs. For example, water and chemicals, as well as energy enter and leave the boundaries of a watershed system. Outputs from one part of the system are inputs for another part. This linked output-input connection is often called ‘feedback’. The inputs and outputs are important for understanding the dynamics of the system you are studying as these are the key for helping us identify one system from another.

This lesson introduces the Earth system science spheres through model making and discussion.


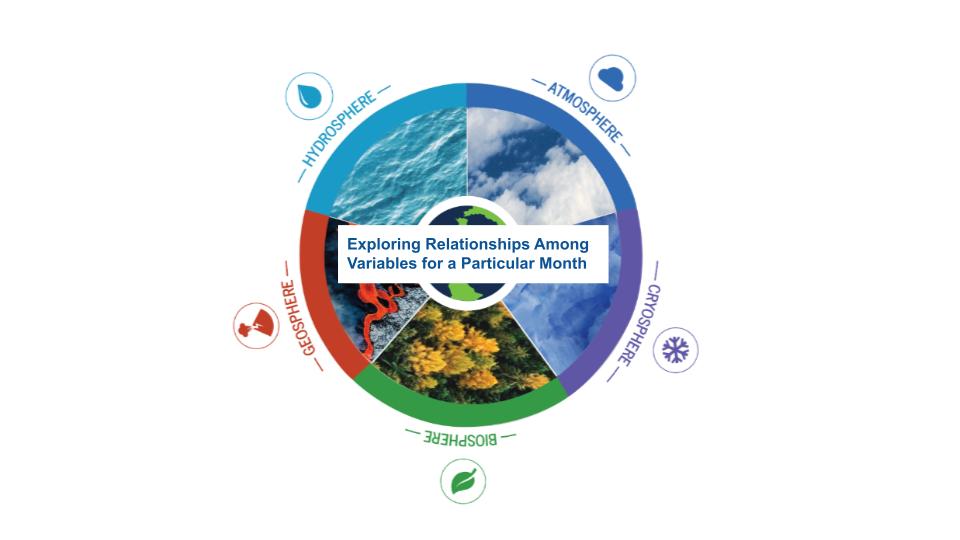
The Earth System Satellite Images, along with the Data Literacy Cubes, help the learner determine relationships among variables.

The Earth System Satellite Images, along with the Data Literacy Cubes, help the learner visualize how different Earth system variables change over time, identify patterns, and determine relationships among two variables in three months.
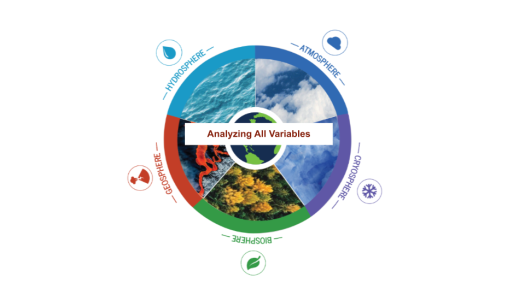
The Earth System Satellite Images, help the learner visualize how different Earth system variables change over time, establish cause and effect relationships for a specific variable, identify patterns, and determine relationships among variables over one year.
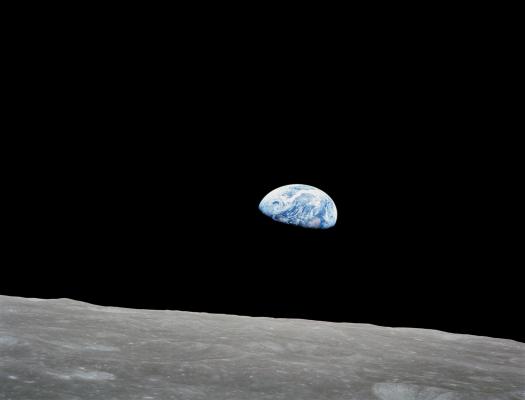
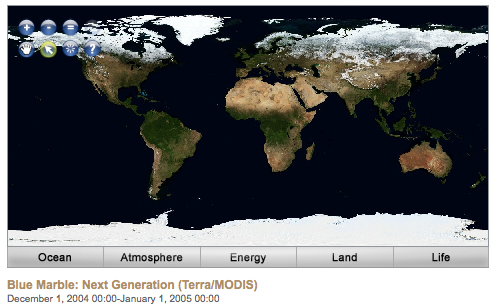
Students are introduced to the Earthrise phenomenon by seeing the Earth as the Apollo 8 astronauts viewed our home planet for the first time from the Moon. They will analyze a time series of mapped plots of Earth science variables that NASA monitors to better understand the Earth
This activity was developed by NASA's Global Precipitation Measurement (GPM) team as an introductory experience to a series of lessons about water resources on Earth.


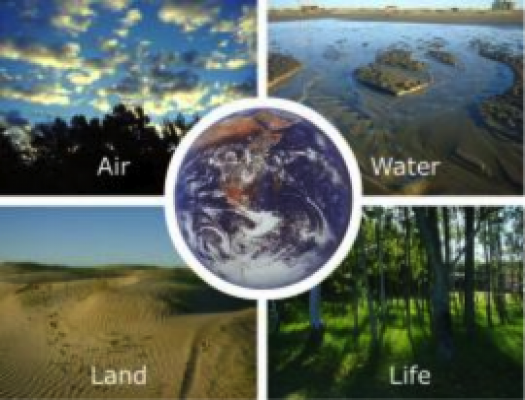
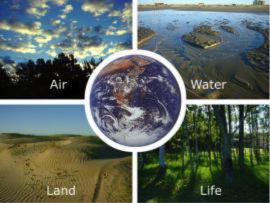
Air, Water, Land, & Life: A Global Perspective
NASA visualizers take data – numbers, codes – and turn them into animations people can see and quickly understand.
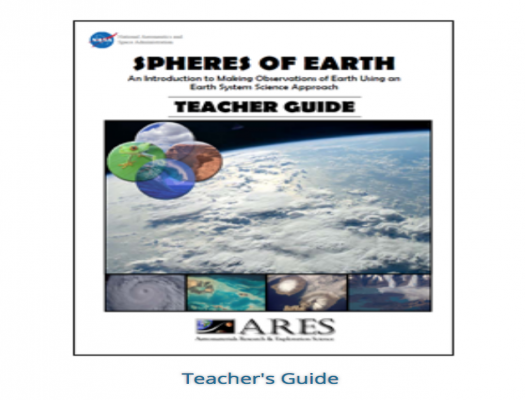
This activity introduces students to aspects of the atmosphere, biosphere, hydrosphere, and litho/geosphere and how they are interrelated. It is designed to promote an interest in authentic investigations of Earth using images acquired by astronauts as the hook.
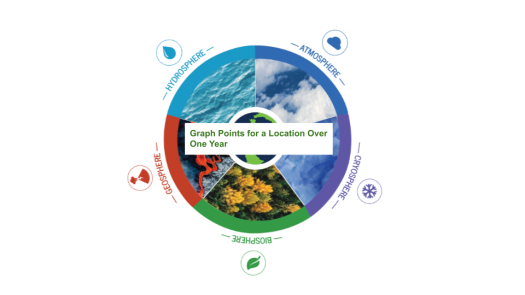
The Earth System Satellite, help the learner visualize how different Earth system variables change over time. In this lesson, students will graph six points for a location over one year.
This lesson introduces the Earth system science spheres through model making and discussion.
The Earth System Satellite Images, along with the Data Literacy Cubes, help the learner determine relationships among variables.

The Earth System Satellite Images, along with the Data Literacy Cubes, help the learner visualize how different Earth system variables change over time, identify patterns, and determine relationships among two variables in three months.

The Earth System Satellite Images, help the learner visualize how different Earth system variables change over time, establish cause and effect relationships for a specific variable, identify patterns, and determine relationships among variables over one year.

Students are introduced to the Earthrise phenomenon by seeing the Earth as the Apollo 8 astronauts viewed our home planet for the first time from the Moon. They will analyze a time series of mapped plots of Earth science variables that NASA monitors to better understand the Earth
This activity was developed by NASA's Global Precipitation Measurement (GPM) team as an introductory experience to a series of lessons about water resources on Earth.
Air, Water, Land, & Life: A Global Perspective

NASA visualizers take data – numbers, codes – and turn them into animations people can see and quickly understand.

This activity introduces students to aspects of the atmosphere, biosphere, hydrosphere, and litho/geosphere and how they are interrelated. It is designed to promote an interest in authentic investigations of Earth using images acquired by astronauts as the hook.

The Earth System Satellite, help the learner visualize how different Earth system variables change over time. In this lesson, students will graph six points for a location over one year.