Any system within the Earth system is considered an open system. Because energy flows freely into and out of systems, all systems respond to inputs and, as a result, have outputs. For example, water and chemicals, as well as energy enter and leave the boundaries of a watershed system. Outputs from one part of the system are inputs for another part. This linked output-input connection is often called ‘feedback’. The inputs and outputs are important for understanding the dynamics of the system you are studying as these are the key for helping us identify one system from another.
>> Read More >>
Just one moment,
loading Earth as a System...
Featured Interactives
-
-
-
-
-
Grade Level: 6-8, 9-12
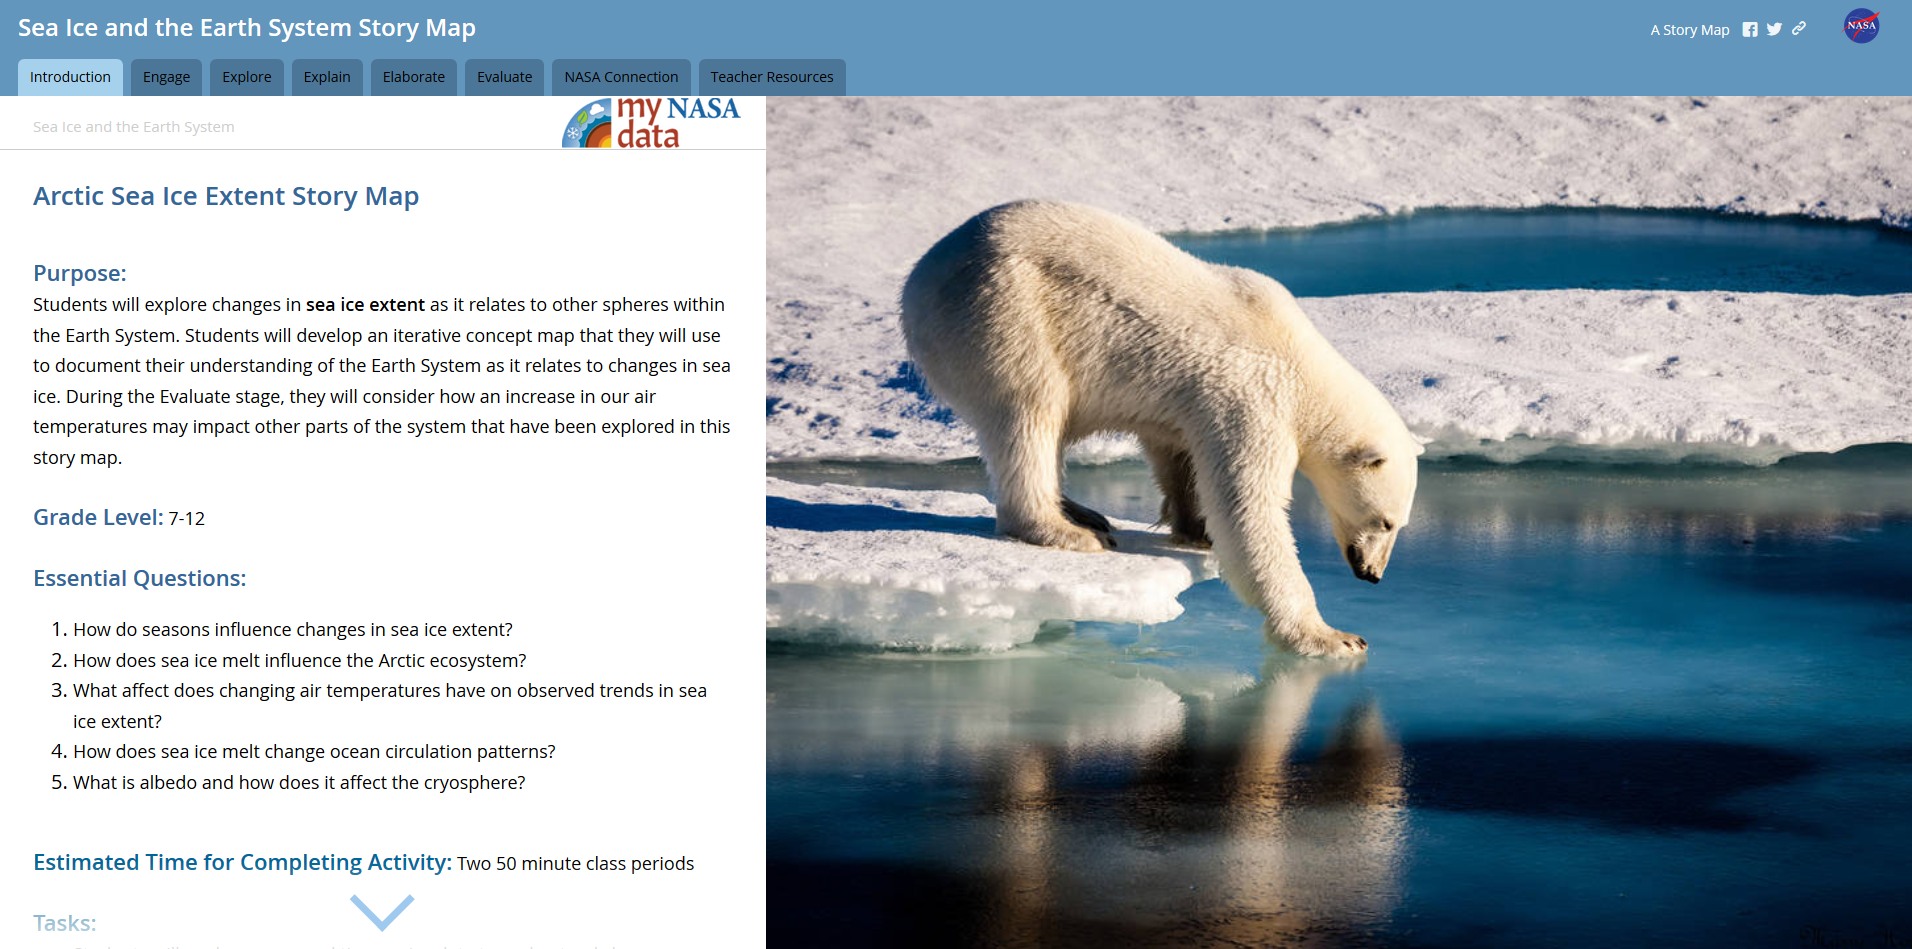
Using various visualizations (i.e., images, charts, and graphs), students will explore changes in sea ice extent as it relates to other spheres within the Earth System. This story map is intended to be used with students who have access to a computing device in a 1:1 or 1:2 setting.
Grade Level: 3-5, 6-8, 9-12
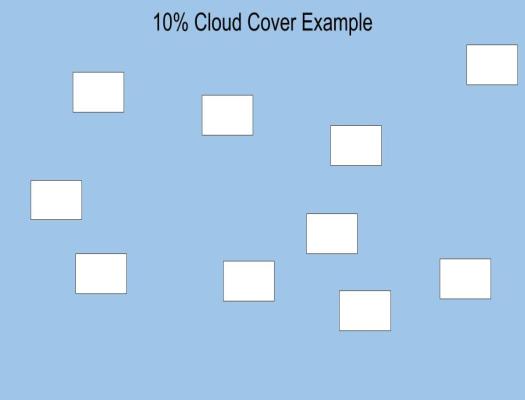
This activity will help students better understand and practice estimating percent cloud cover.
Grade Level: 3-5, 6-8
Learn about the different cloud types and their names. Match cloud photos and names by cloud type and for all types. Evaluate the types of clouds represented in various data displays.
Grade Level: 6-8
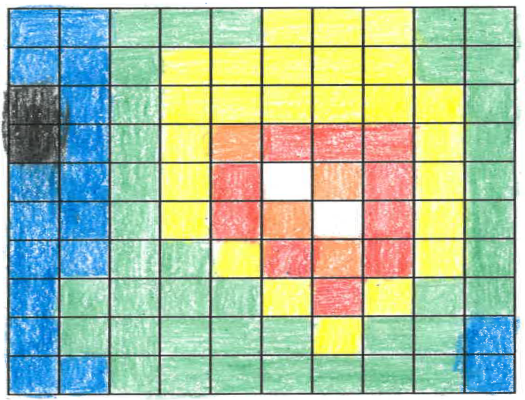
Scientific data are often represented by assigning ranges of numbers to specific colors. The colors are then used to make false color images which allow us to see patterns more easily. Students will make a false-color image using a set of numbers.
Grade Level: 9-12
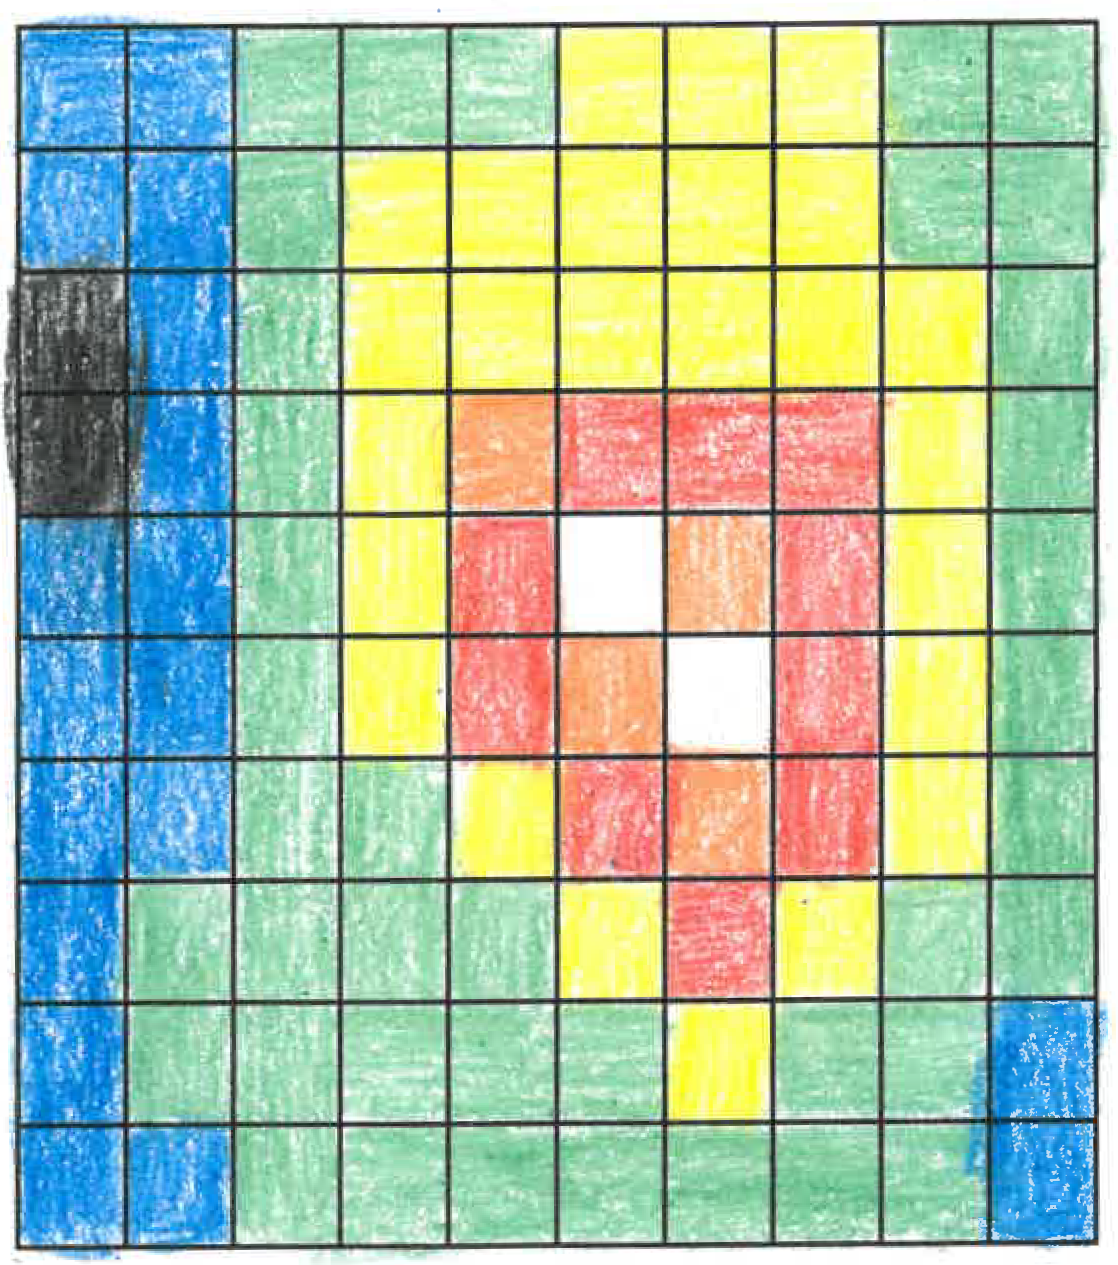
Information from satellites if often used to display information about objects. This information can include how things appear, as well as their contents. Explore how pixel data sequences can be used to create an image and interpret it.
Previous
Next
Grade Level: 6-8,
9-12
Using various visualizations (i.e., images, charts, and graphs), students will explore changes in sea ice extent as it relates to other spheres within the Earth System. This story map is intended to be used with students who have access to a computing device in a 1:1 or 1:2 setting.
Grade Level: 3-5,
6-8,
9-12
This activity will help students better understand and practice estimating percent cloud cover.
Grade Level: 3-5,
6-8
Learn about the different cloud types and their names. Match cloud photos and names by cloud type and for all types. Evaluate the types of clouds represented in various data displays.
Grade Level: 6-8
Scientific data are often represented by assigning ranges of numbers to specific colors. The colors are then used to make false color images which allow us to see patterns more easily. Students will make a false-color image using a set of numbers.
Grade Level: 9-12
Information from satellites if often used to display information about objects. This information can include how things appear, as well as their contents. Explore how pixel data sequences can be used to create an image and interpret it.
Systems and Systems Models landing page. Explore maps, graphs, data, and related education resources. These resources include lesson plans, mini lessons, activities, and datasets for teachers and students.