Mini Lesson/Activity
Comparing Global Land Use Over Time
Overview
Examine the images to see the projected differences in land use between 1900 and 2100.
Student Directions
Background
Primary land cover is natural vegetation that has never been disturbed by human activities such as agriculture or wood harvesting.
Secondary land cover is also natural vegetation that is recovering from human activities. It can be very young or as mature as primary land cover. Even if it is mature, it is not considered primary because it has been disturbed and has recovered.
The images below represent the percent of land cover which is considered to be primary land cover for the years 1900 and 2100 at a spatial resolution of approximately 50 km. The data for 1900 are historical. The data for 2100 are projections from 2006-2100 using four Integrated Assessment Model (IAM) scenarios with respect to changes in Earth's energy budget.
Steps
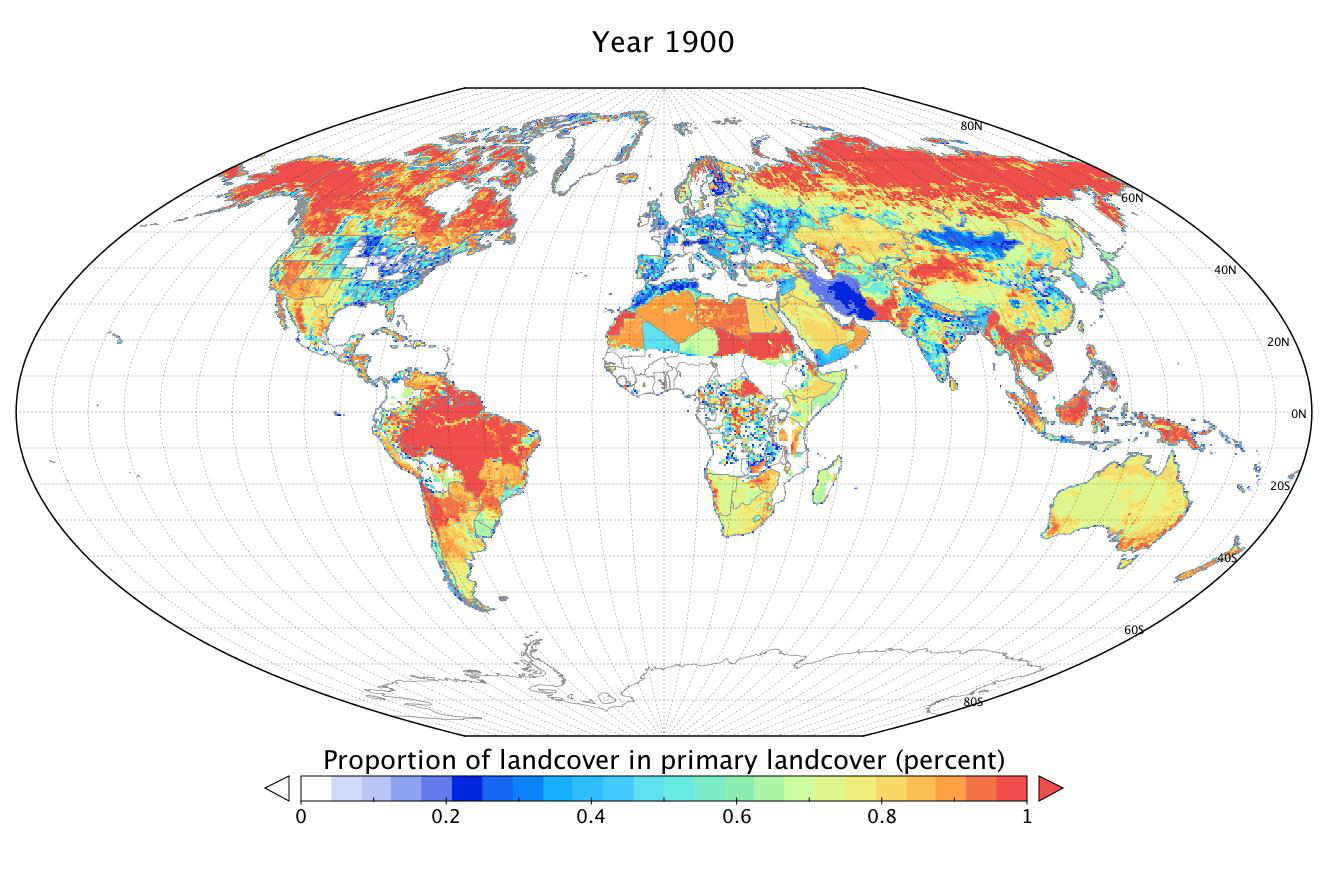
Image Credit: NASA Oak Ridge National Laboratory DAAC
https://mynasadata.larc.nasa.gov/sites/default/files/inline-images/1900.png
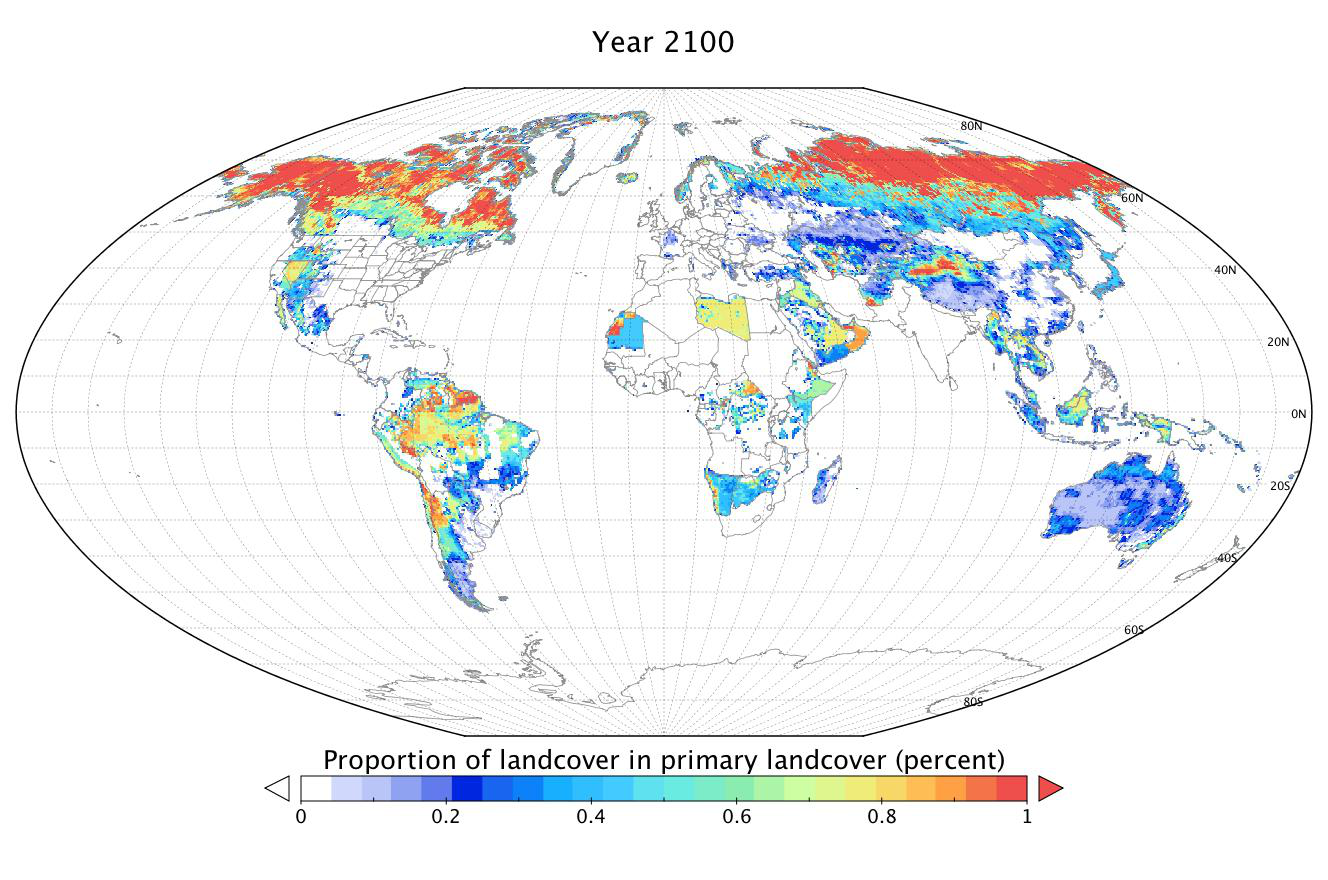
Image Credit: NASA Oak Ridge National Laboratory DAAC
https://mynasadata.larc.nasa.gov/sites/default/files/inline-images/2100.png
-
Examine the images to see the projected differences between 1900 and 2100 and answer the questions. Check with your instructor on how to submit answers.
- What differences do you see?
- Which color shows the highest primary land cover percentage? Lowest?
- Describe where you would expect to find the highest percentage of primary land cover in 2100. Lowest?
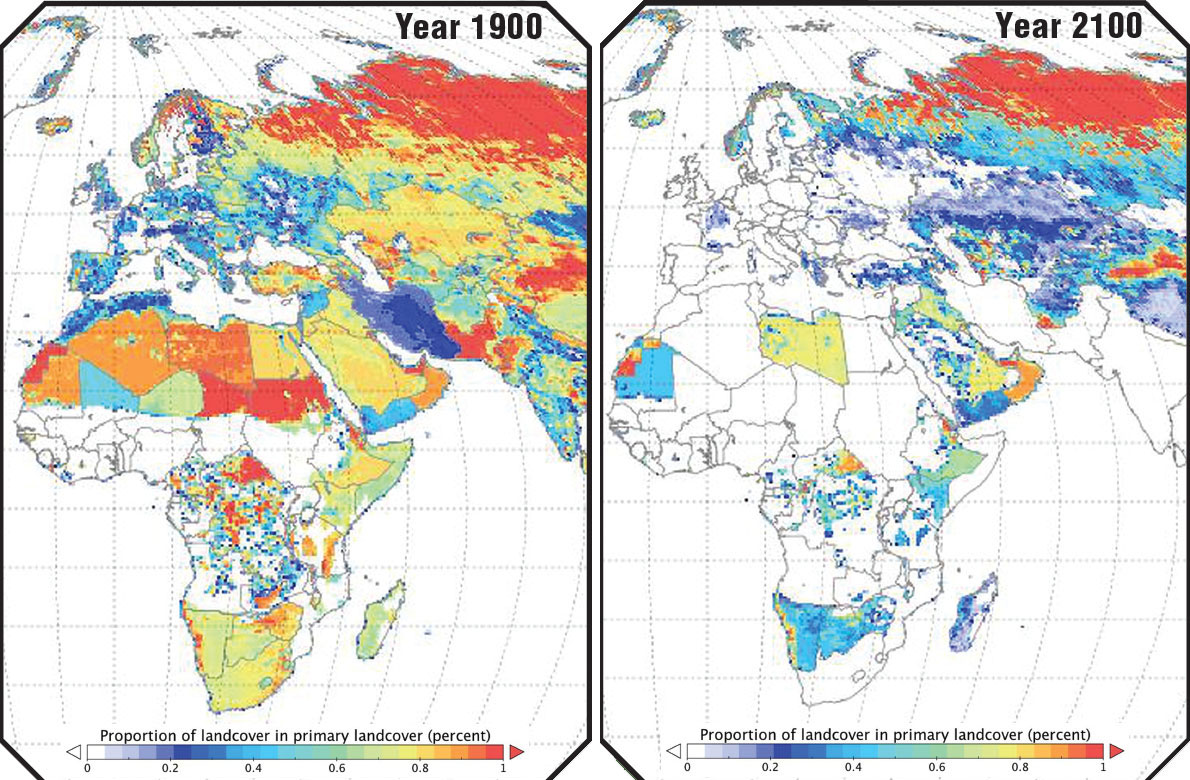
Proportion of landcover in primary landcover (percent) for 1900 and projected for 2100
Image Credit: NASA Oak Ridge National Laboratory DAAC
https://mynasadata.larc.nasa.gov/sites/default/files/inline-images/primary%20land%20cover_0.jpg - Examine the images of Africa and answer the questions to write a caption for the images of Africa.
- What do you observe in Africa for 1900?
- What do you observe in Africa for 2100?
- What are the differences?
- What do these differences signify?
- Write the caption.

Sources
- Images: NASA Oak Ridge National Laboratory DAAC
- Data: Chini, L.P., G.C. Hurtt, and S. Frolking. 2014. Harmonized Global Land Use for Years 1500 – 2100, V1. Data set. Available on-line [http://daac.ornl.gov] from Oak Ridge National Laboratory Distributed Active Archive Center, Oak Ridge, Tennessee, USA. http://dx.doi.org/10.3334/ORNLDAAC/1248
- “Land Cover and Land Use Change Information.” NASA, NASA, 25 Apr. 2022, https://earthdata.nasa.gov/user-resources/lcluc-information.
Teacher Note
Teachers, these mini lessons/student activities are perfect "warm up" tasks that can be used as a hook, bellringer, exit slip, etc. They take less than a class period to complete. Learn more on the "My NASA Data What are Mini Lessons?" page.
Teachers who are interested in receiving the answer key, please complete the Teacher Key Request and Verification Form. We verify that requestors are teachers prior to sending access to the answer keys as we’ve had many students try to pass as teachers to gain access.
Supported NGSS Performance Expectations
- MS-ESS3-4: Construct an argument supported by evidence for how increases in human population and per-capita consumption of natural resources impact Earth's systems.
- MS-ESS3-3: Apply scientific principles to design a method for monitoring and minimizing a human impact on the environment.
- HS-ESS3-1: Construct an explanation based on evidence for how the availability of natural resources, occurrence of natural hazards, and changes in climate have influenced human activity.