Mini Lesson/Activity
Air Temperatures Around the World
Overview
Students observe the map image, individually, looking for changes in surface air temperatures (using data displayed, unit of measure, range of values, etc.) and noticeable patterns.
Student Directions
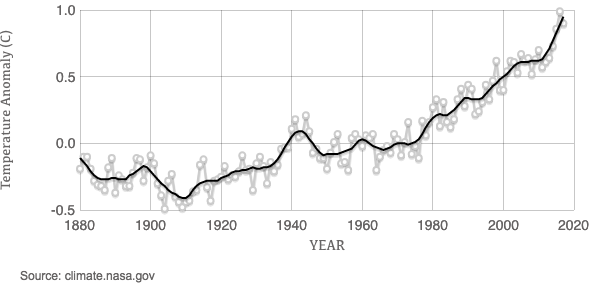
NASA's Goddard Institute for Space Studies (GISS) provides monthly maps and graphs. GISTEMP is one of the main datasets scientists use to check variability and trends. They showcase surface air temperature changes for each month since 1880. This was a time meteorological stations were established around the world.
So how different are current temperatures from the past? How much have these values changed over time?
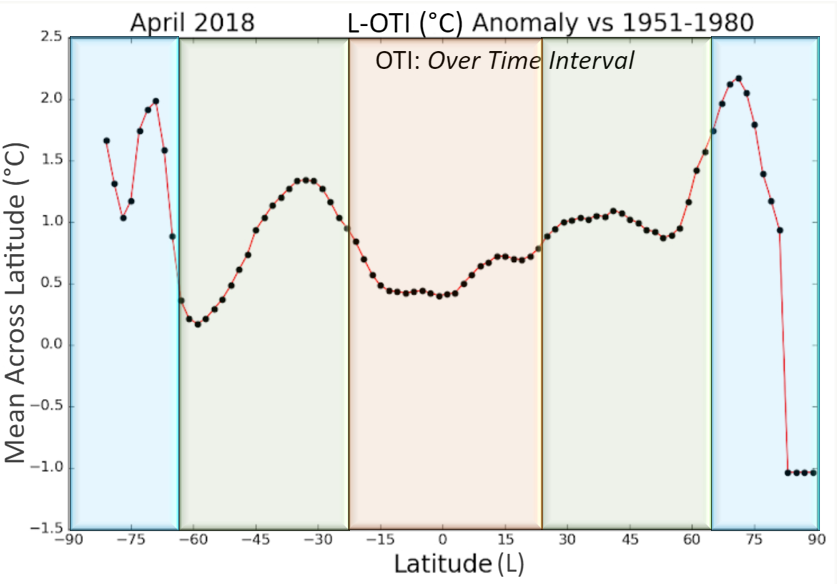
Students may access these GISTEMP maps to analyze the monthly anomalies of surface air temperatures. An anomaly is a departure from average conditions. A temperature anomaly shows how much warmer or colder it is than normal for a particular place and time. For this analysis, we identify normal as the average over the 30-year period (1951-1980).
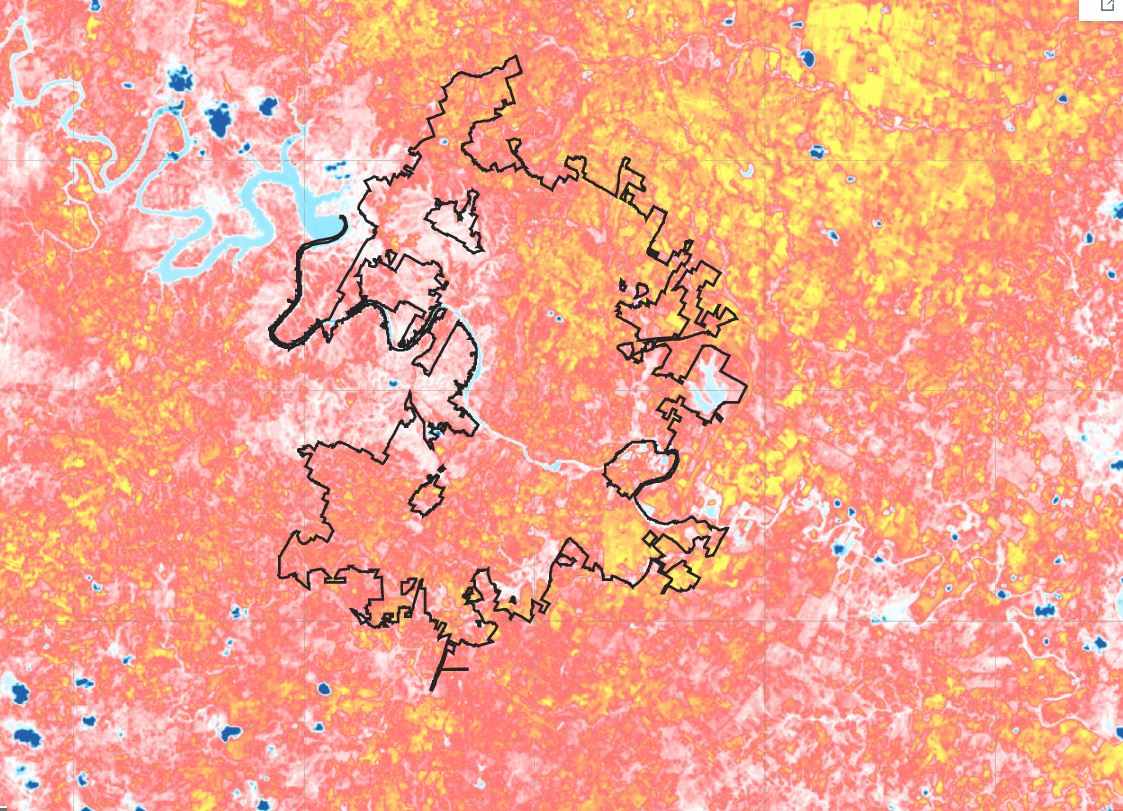
The image shows the annual mean for 2020 (January - December). The number at the top right-hand corner of the map plot is an estimate of the global average anomaly.
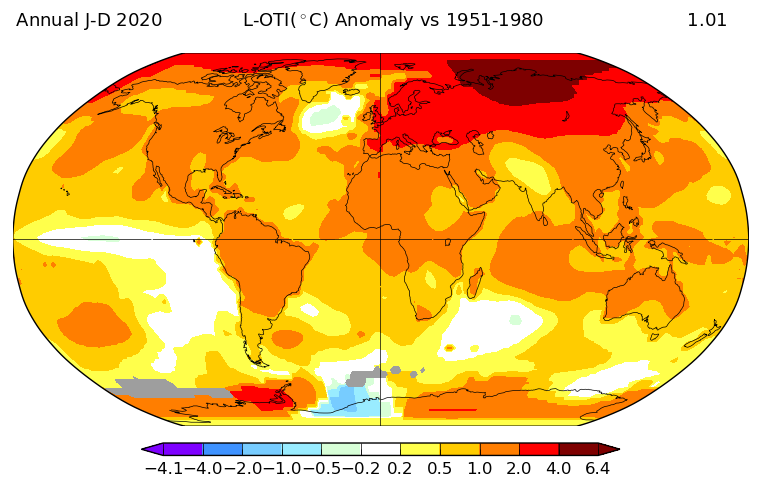
Surface Temperature Global Anomaly
Credit: NASA GISS
https://data.giss.nasa.gov/gistemp/maps/
Steps:
- Check with your instructor on how to submit your answers.
- What does surface air temperature anomaly mean?
- What is the range of values shown on the scale bar? Explain what those values mean?
- Identify the locations on the map where you would find the highest and lowest values (the extremes) of the data.
- Explain why your selected locations experience these extremes while other parts of the world do not.
Key Terms:
- Anomaly: Difference between the mean temperature (°C) averaged over a specified mean period and time interval and the mean temperature during a given base period.
- Example of an anomaly: The difference between average January temperatures during 2000-2020 and a base period of 1951-1980.
- Mean period: Any monthly, seasonal (3 months or 6 months) or annual mean. [January in example]
- Time interval: Years over which temperatures are averaged or trends are found. [2000-2020 in example]
- Base period: Time interval to which anomalies are relative. [1951-1980 in example]
Sources:
- GISS Surface Temperature Analysis (v4): Global Maps. (2021, April 4). NASA Giss. Retrieved May 24, 2022, from https://data.giss.nasa.gov/gistemp/maps/
Teacher Note
Teachers, these mini lessons/student activities are perfect "warm up" tasks that can be used as a hook, bellringer, exit slip, etc. They take less than a class period to complete. Learn more on the "My NASA Data What are Mini Lessons?" page.
Teachers who are interested in receiving the answer key, please complete the Teacher Key Request and Verification Form. We verify that requestors are teachers prior to sending access to the answer keys as we’ve had many students try to pass as teachers to gain access.