Energy powers the transformation and movement of matter in all Earth system processes. Earth’s major cycles connecting matter found within the different spheres include the energy cycle, the water cycle, and the cycles of important individual elements (e.g., carbon and nitrogen).
>> Read More >>
Just one moment,
loading Earth as a System...
Featured Interactives
-
-
-
-
-
-
-
Grade Level: 3-5, 6-8, 9-12
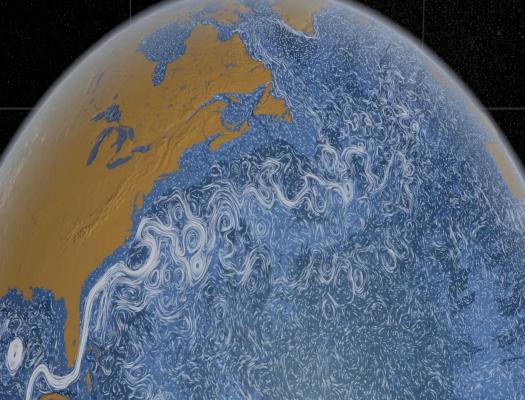
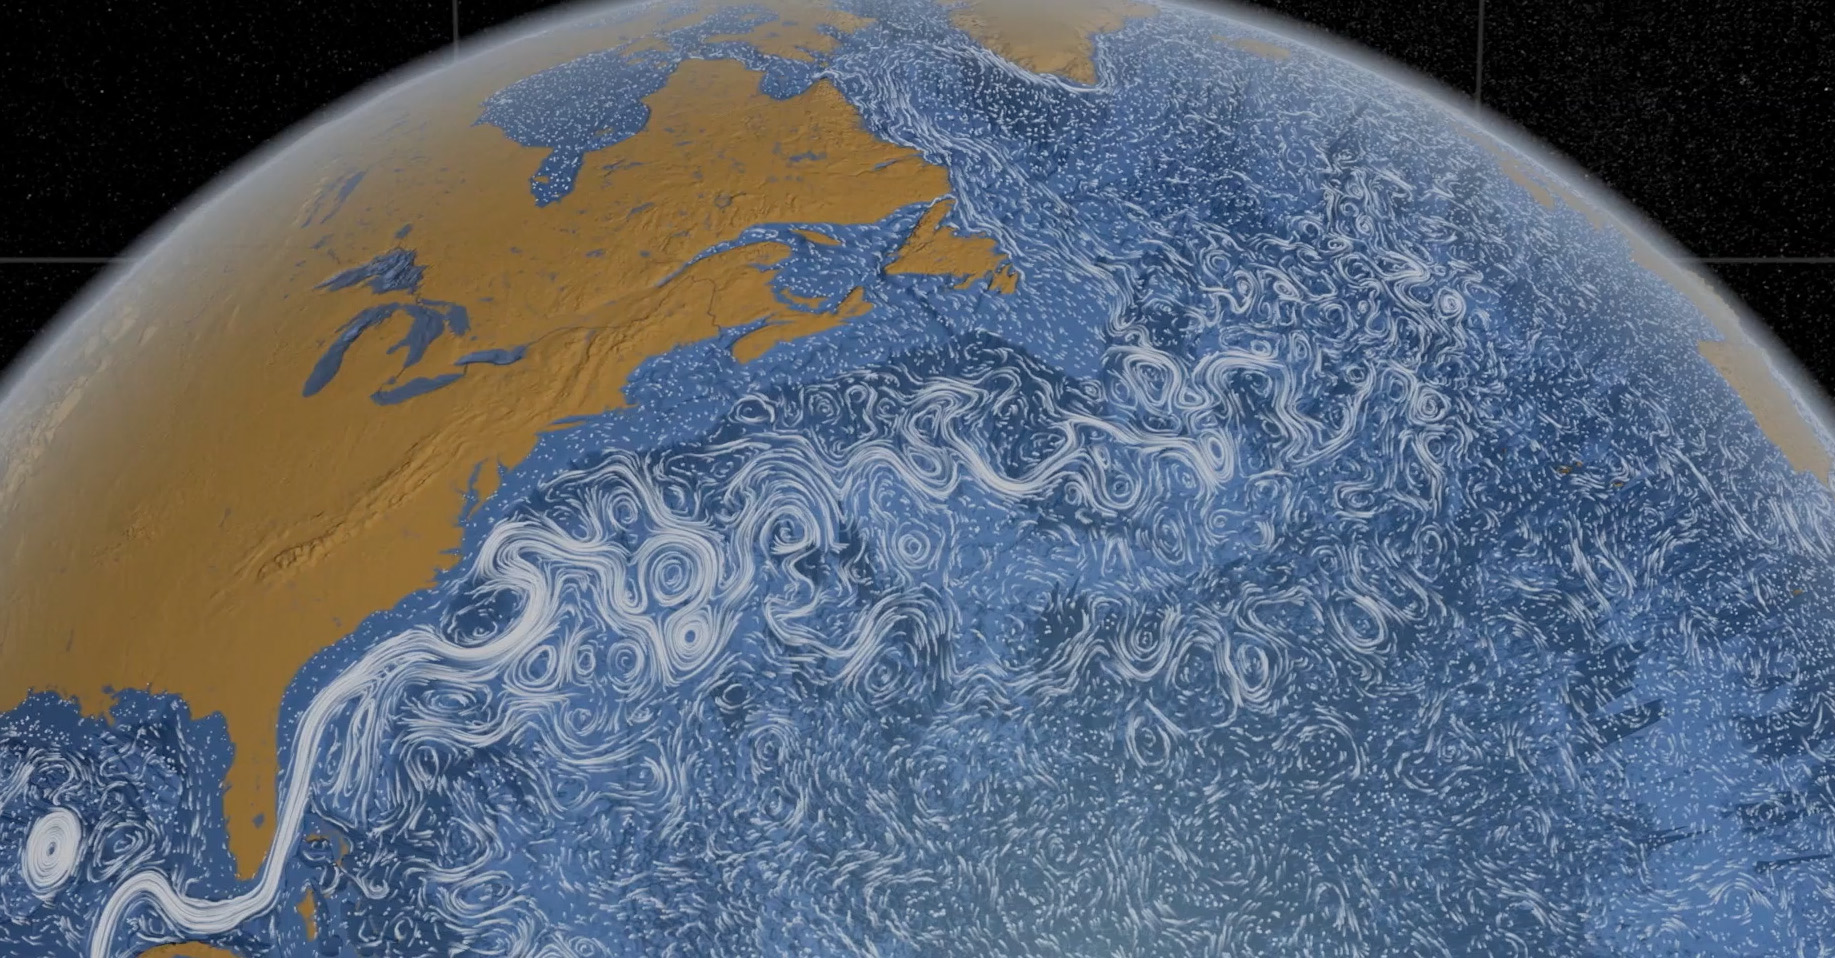
This story map lesson plan allows students to explore ocean circulation patterns as they relate to the world's ocean garbage patches using NASA ocean currents data.
Grade Level: 3-5, 6-8, 9-12
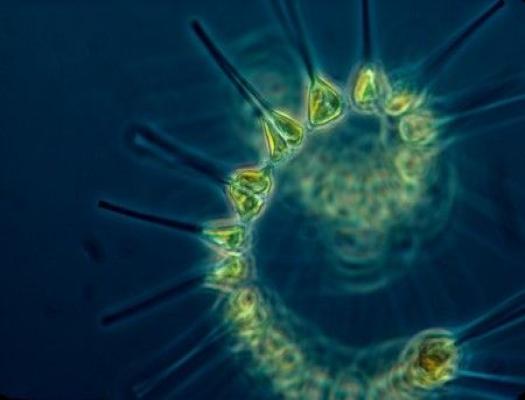
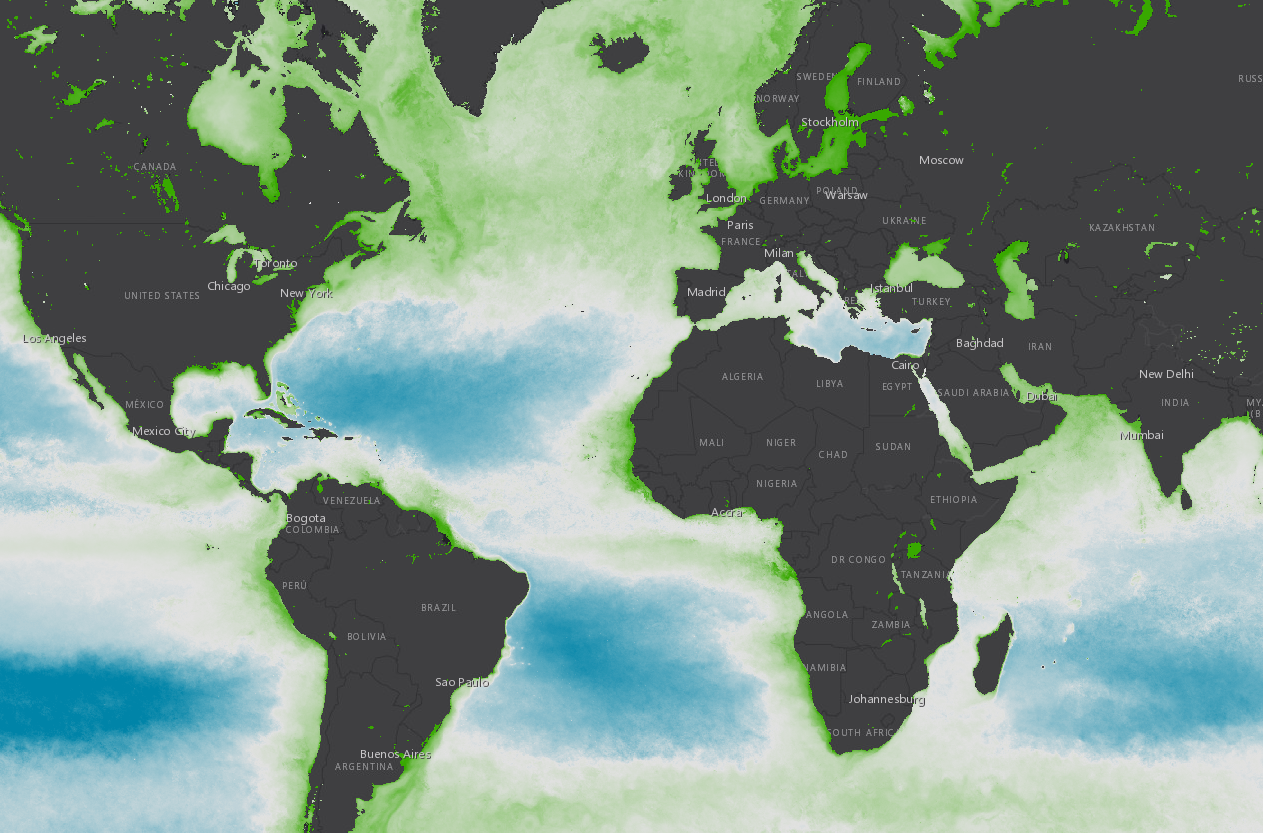
This story map lesson plan allows students to explore global phytoplankton distribution using chlorophyll concentration data in a 5 E-learning cycle.
Grade Level: 3-5, 6-8
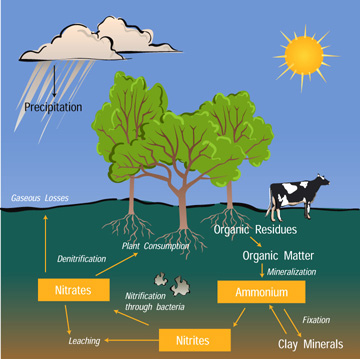
Students will explore the Nitrogen Cycle by modeling the movement of a nitrogen atom as it passes through the cycle. Students will stop in the different reservoirs along the way, answering questions about the processes that brought them to the different reservoirs.
Grade Level: 3-5, 6-8, 9-12
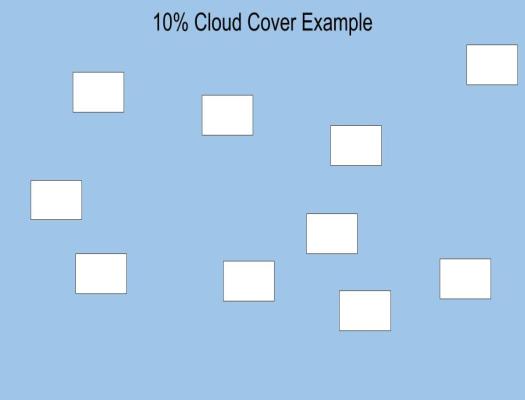
This activity will help students better understand and practice estimating percent cloud cover.
Grade Level: 6-8
Students observe seasonal images of Monthly Normalized Difference Vegetation, looking for any changes in vegetation that are occurring throughout the year. They put the images in order based on what they know about seasonal changes.
Grade Level: 6-8
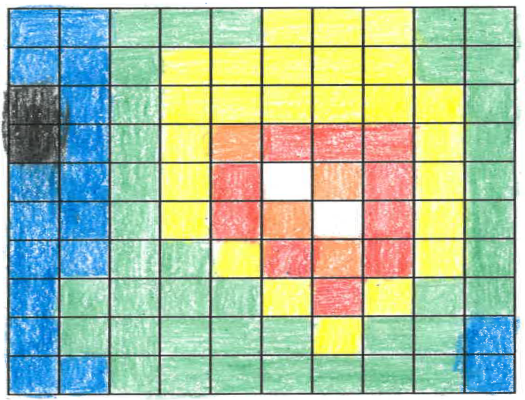
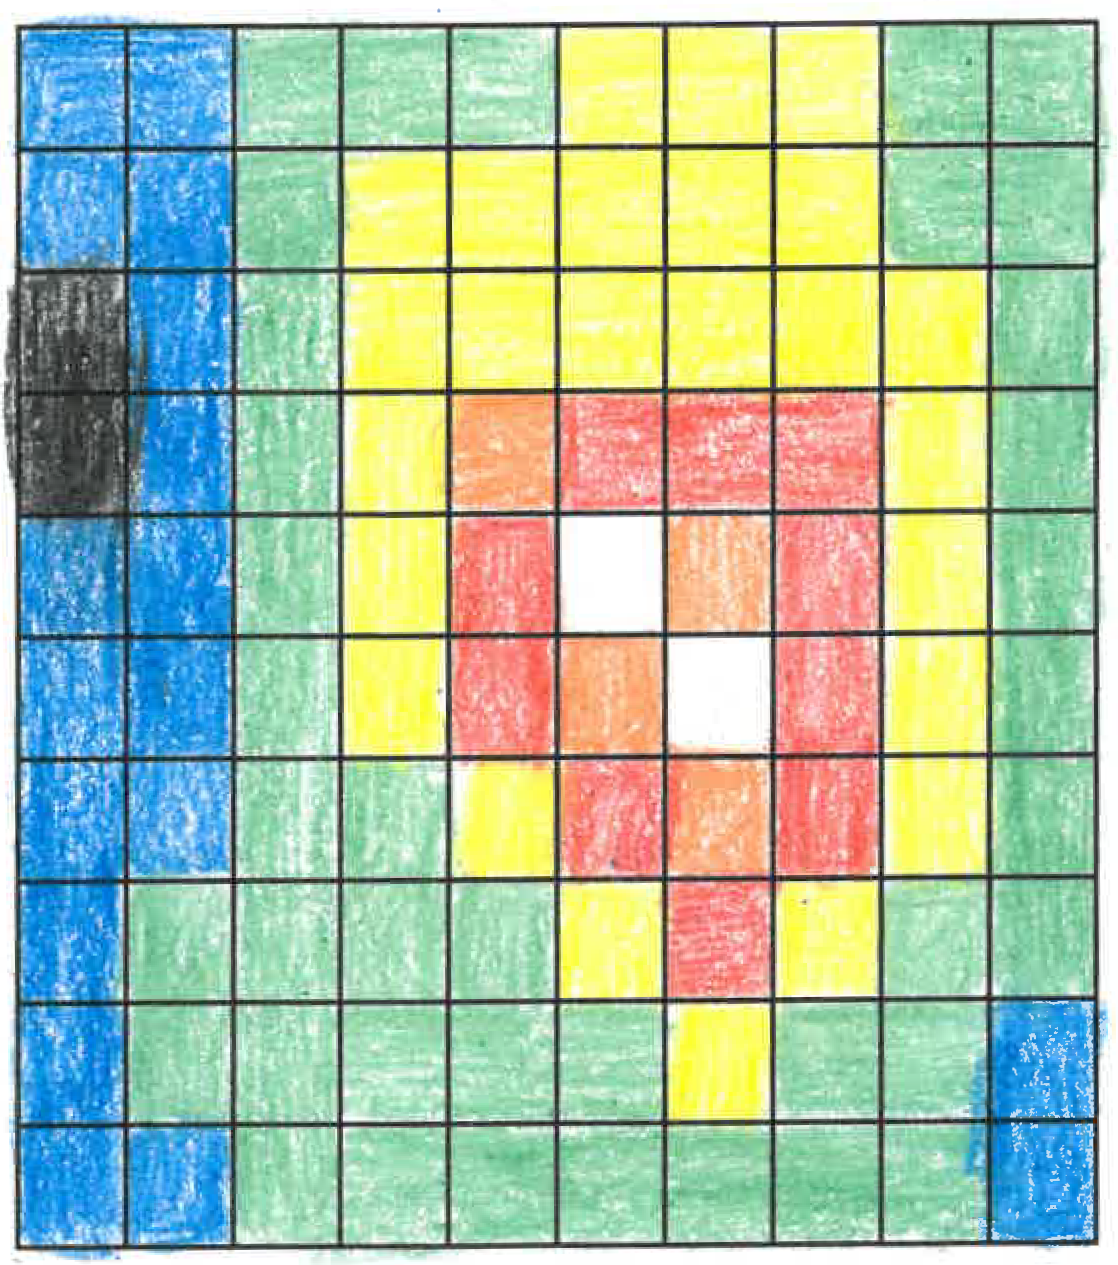
Scientific data are often represented by assigning ranges of numbers to specific colors. The colors are then used to make false color images which allow us to see patterns more easily. Students will make a false-color image using a set of numbers.
Grade Level: 9-12
Information from satellites if often used to display information about objects. This information can include how things appear, as well as their contents. Explore how pixel data sequences can be used to create an image and interpret it.
Previous
Next
Grade Level: 3-5,
6-8,
9-12
This story map lesson plan allows students to explore ocean circulation patterns as they relate to the world's ocean garbage patches using NASA ocean currents data.
Grade Level: 3-5,
6-8
Students will explore the Nitrogen Cycle by modeling the movement of a nitrogen atom as it passes through the cycle. Students will stop in the different reservoirs along the way, answering questions about the processes that brought them to the different reservoirs.
Grade Level: 3-5,
6-8,
9-12
This activity will help students better understand and practice estimating percent cloud cover.
Grade Level: 6-8
Students observe seasonal images of Monthly Normalized Difference Vegetation, looking for any changes in vegetation that are occurring throughout the year. They put the images in order based on what they know about seasonal changes.
Grade Level: 6-8
Scientific data are often represented by assigning ranges of numbers to specific colors. The colors are then used to make false color images which allow us to see patterns more easily. Students will make a false-color image using a set of numbers.
Grade Level: 9-12
Information from satellites if often used to display information about objects. This information can include how things appear, as well as their contents. Explore how pixel data sequences can be used to create an image and interpret it.
Grade Level: 3-5,
6-8,
9-12
Students identify patterns in chlorophyll concentration data to formulate their explanations of phytoplankton distribution.
Energy and Matter landing page. Explore maps, graphs, data, and related education resources. These resources include lesson plans, mini lessons, activities, and datasets for teachers and students.