
Grade Level: 3-5
Students track weather over time and create a bar chart to track their data.
The world's surface air temperature is getting warmer. Whether the cause is human activity or natural changes in the Earth System—and the enormous body of evidence says it’s humans—thermometer readings all around the world have risen steadily since the beginning of the Industrial Revolution.

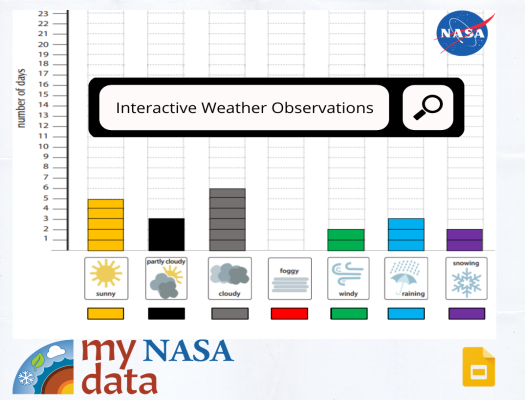
Students track weather over time and create a bar chart to track their data.
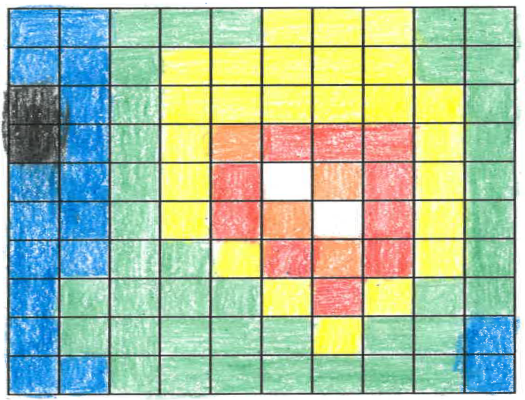
Scientific data are often represented by assigning ranges of numbers to specific colors. The colors are then used to make false color images which allow us to see patterns more easily. Students will make a false-color image using a set of numbers.

Information from satellites if often used to display information about objects. This information can include how things appear, as well as their contents. Explore how pixel data sequences can be used to create an image and interpret it.
Students track weather over time and create a bar chart to track their data.
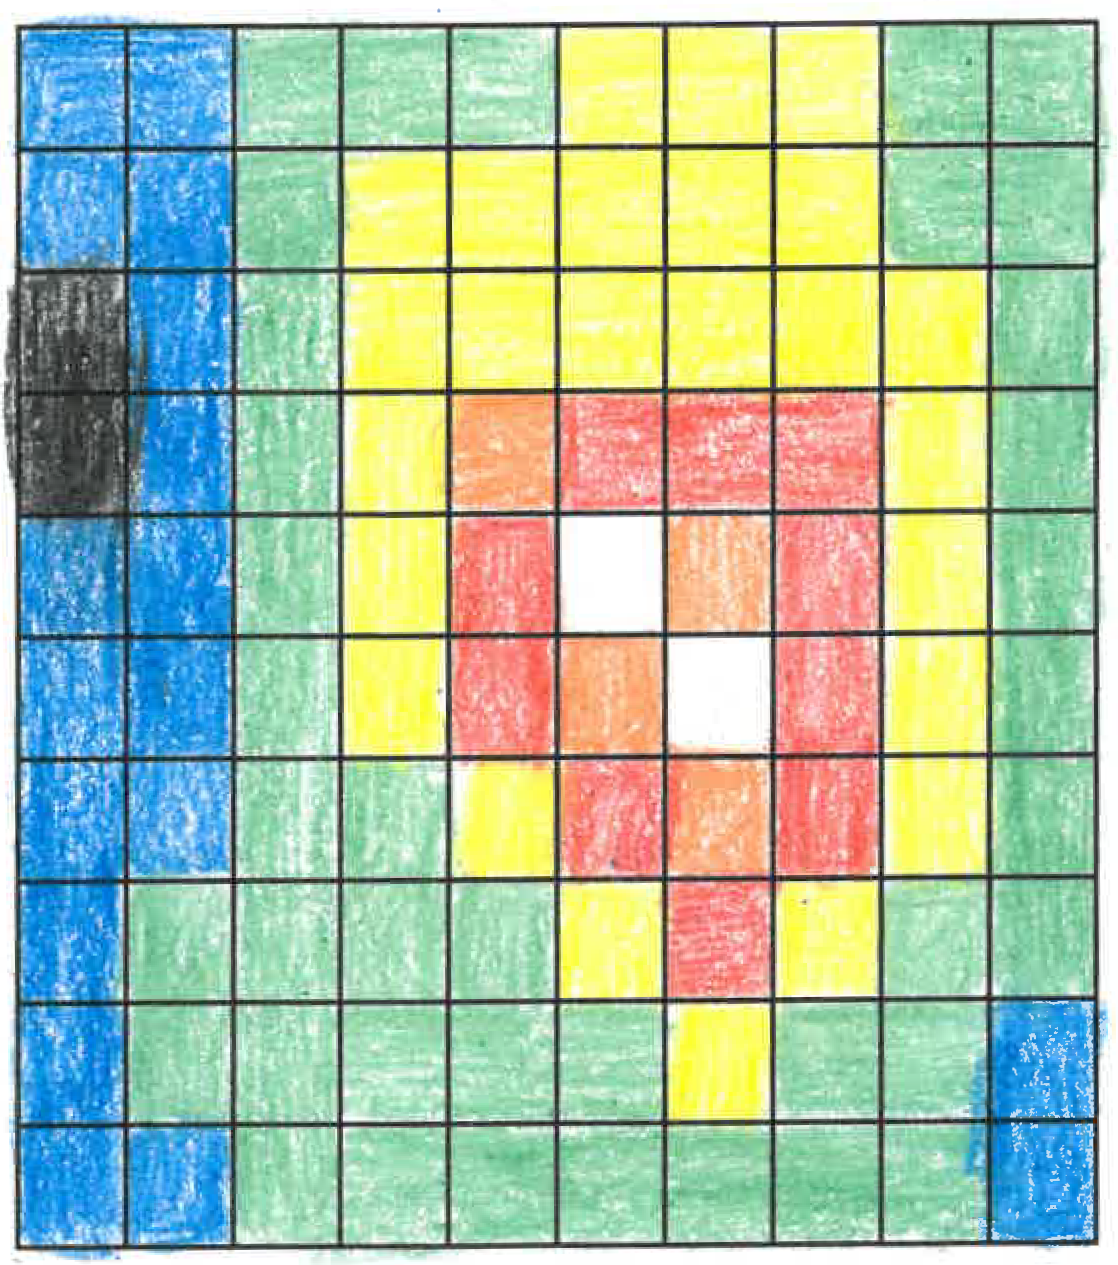
Scientific data are often represented by assigning ranges of numbers to specific colors. The colors are then used to make false color images which allow us to see patterns more easily. Students will make a false-color image using a set of numbers.
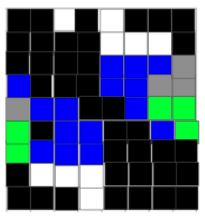
Information from satellites if often used to display information about objects. This information can include how things appear, as well as their contents. Explore how pixel data sequences can be used to create an image and interpret it.