Mini Lesson/Activity
Scale, Proportion, and Quantity: Ice Flow Model
Overview
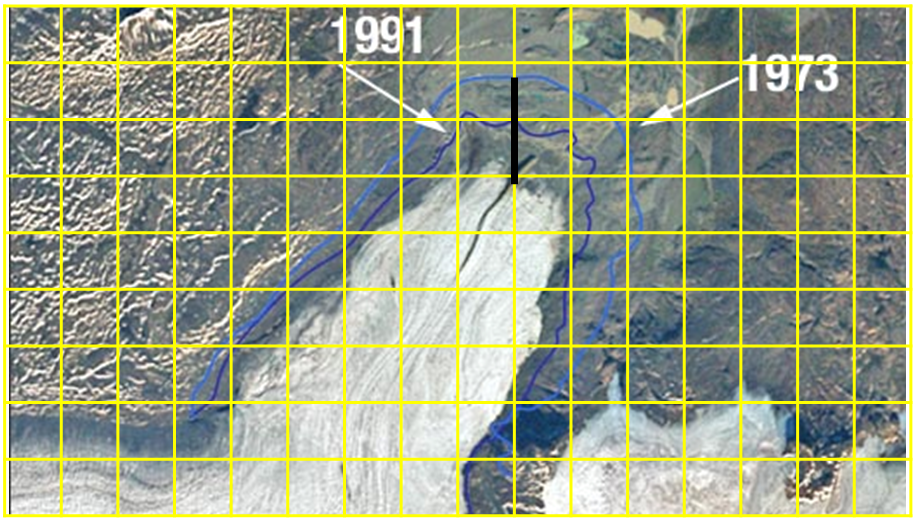
This mini lesson has students explore three visualizations to see the new benchmark map scientists can use to study the extent and speed of changes to the largest ice sheet in the world.
Student Directions
The Earth's system is characterized by the interaction of processes. The processes take place on molecular (very small) and planetary (very large) spatial scales as well as on short and long time scales.
Scientific animations allow us to better understand Earth processes at faster speeds and on smaller scales. This allows scientists improve their data analysis and enhances further understanding.
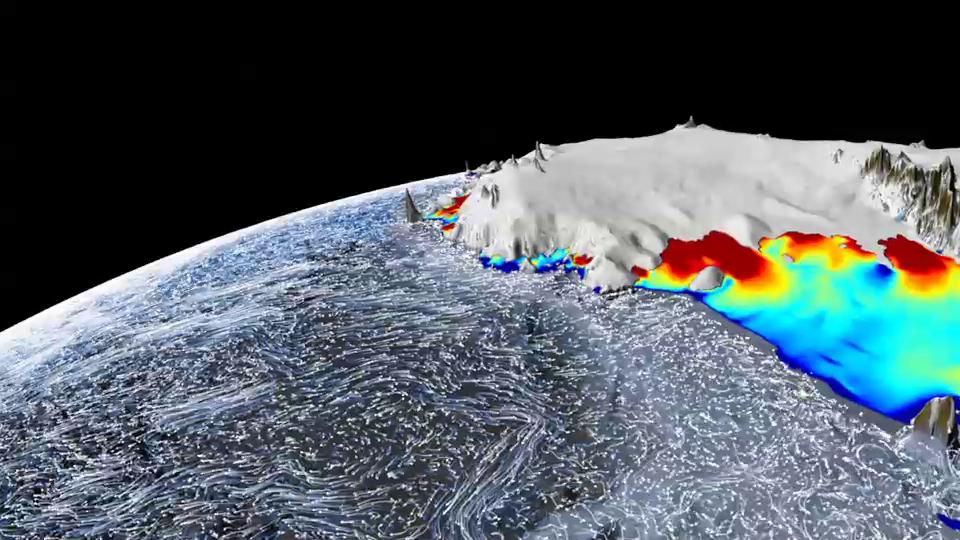
Review the three videos Ice Flow (2011), Ice Flow Uniform Scale, and Ice Flow Glacier Flow. The maps in each video reveal glaciers and tributaries that flow in patterns. They stretch hundreds of miles inland like a system of rivers and creeks.
Video 1:
Slow, interior flows have been sped up to make them more visible. The colors represent the real flow velocity magnitude.
Video 2:
All flows are shown at the same scale. At this scale, only the fastest flows are visible.
Video 3:
Velocity magnitude colors have been removed and the direction of glacial flow stands out clearly against the icy background.
Steps:
- Check with your instructor on how to submit your answers.
- Answer the Exit Ticket Question:
- How do visualizations (which show phenomena on a different time scale) help scientists understand what is happening?
Teacher Note
Teachers, these mini lessons/student activities are perfect "warm up" tasks that can be used as a hook, bell ringer, exit slip, etc. They take less than a class period to complete. Learn more on the "My NASA Data What are Mini Lessons?" page.
Teachers who are interested in receiving the answer key, please complete the Teacher Key Request and Verification Form. We verify that requestors are teachers prior to sending access to the answer keys as we’ve had many students try to pass as teachers to gain access.
Sources:
- Ice Flow (2011). (2018, June 20). YouTube. Retrieved October 11, 2022, from https://www.youtube.com/watch?v=RwI_RG1DFDE
- Ice Flow Uniform Scale. (2018, June 20). YouTube. Retrieved October 11, 2022, from https://www.youtube.com/watch?v=WHS5p0e3fMo
- Ice Flow Glacier Flow. (2018, June 20). YouTube. Retrieved October 11, 2022, from https://www.youtube.com/watch?v=OTZgsVrVJdc