Mini Lesson/Activity
How is My Air?
Overview
Use the AirNow.gov website to determine current air quality in US locations, as well as other information.
Student Directions
Introduction
Before you head outside, how is the air quality? Do you know how to make sure the air is clean enough to work or play outside? Finding this information is so easy! AQI is short for air quality index and is the numerical scale used to indicate the air quality, based on the measurement of particulate matter or other pollutants. Color-coding makes the scale quick and easy to read.
This scale is used by the Environmental Protection Agency (EPA) to rate air quality. The numeric values are determined by pollutants measured using sensitive equipment in many locations. The higher the number, the more pollution measured.
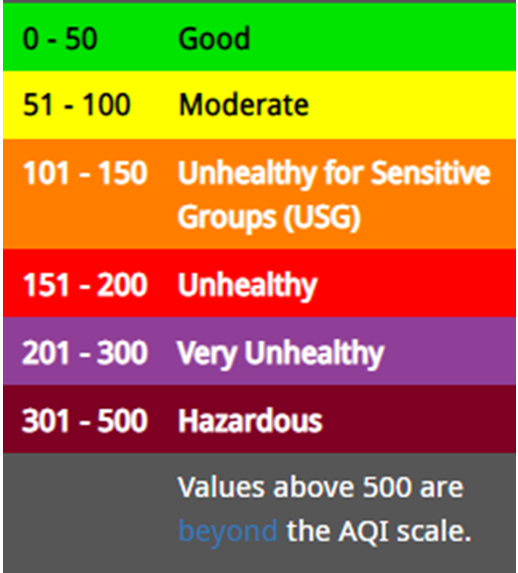
Source: epa.gov
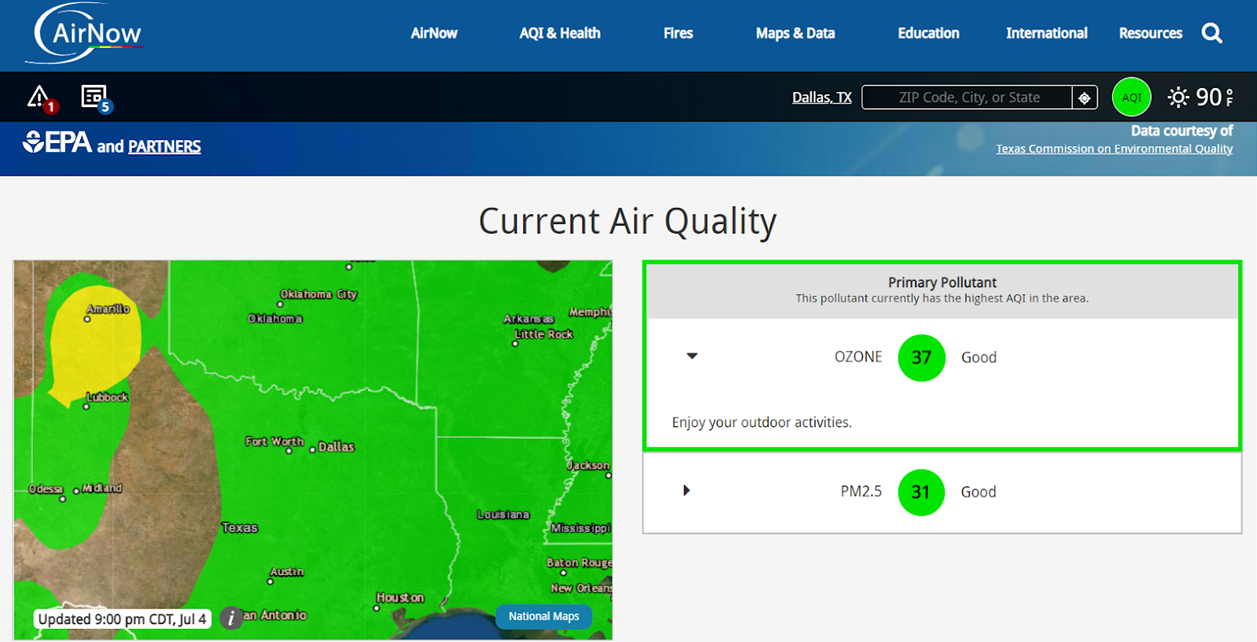
The image below shows the air quality data for a specific location (Dallas, Texas), showing the numeric rating (37), the color rating (green), and the overall air quality (good) for this location on July 1, 2022, at 9 AM, central daylight time.
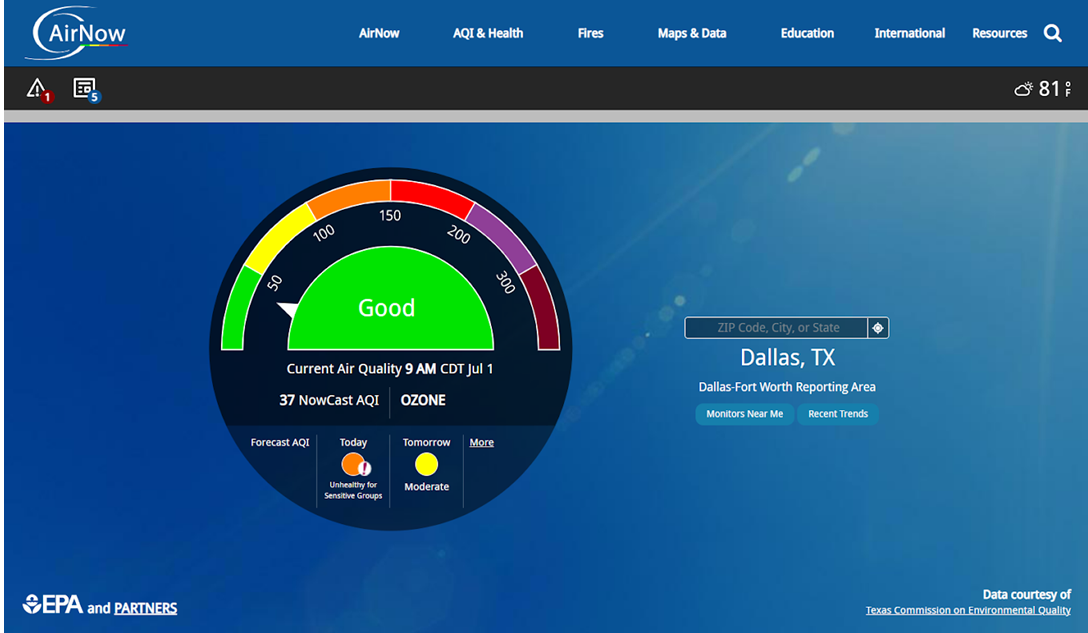
Credit: airnow.gov
In the upper right are the current sky and temperature conditions. The colorful dial shows the scale of the air quality readings and below are the numerical values that determine the color. In the center of the dial is the current rating of the air based on the color.
Below the colorful scale, the primary pollutant that is used to determine the AQI in that area, which can vary by location, is identified, along with the current measurement. This value can change hourly, based on the source of the data. The hour of the reading is listed with the date. The pollutant used for determining the AQI rating is listed first (in this example, ozone).
Credit: airnow.gov
Below the map the current AQI forecast for the rest of the day and the next day is shown. Projected levels for pollutants are also shown.
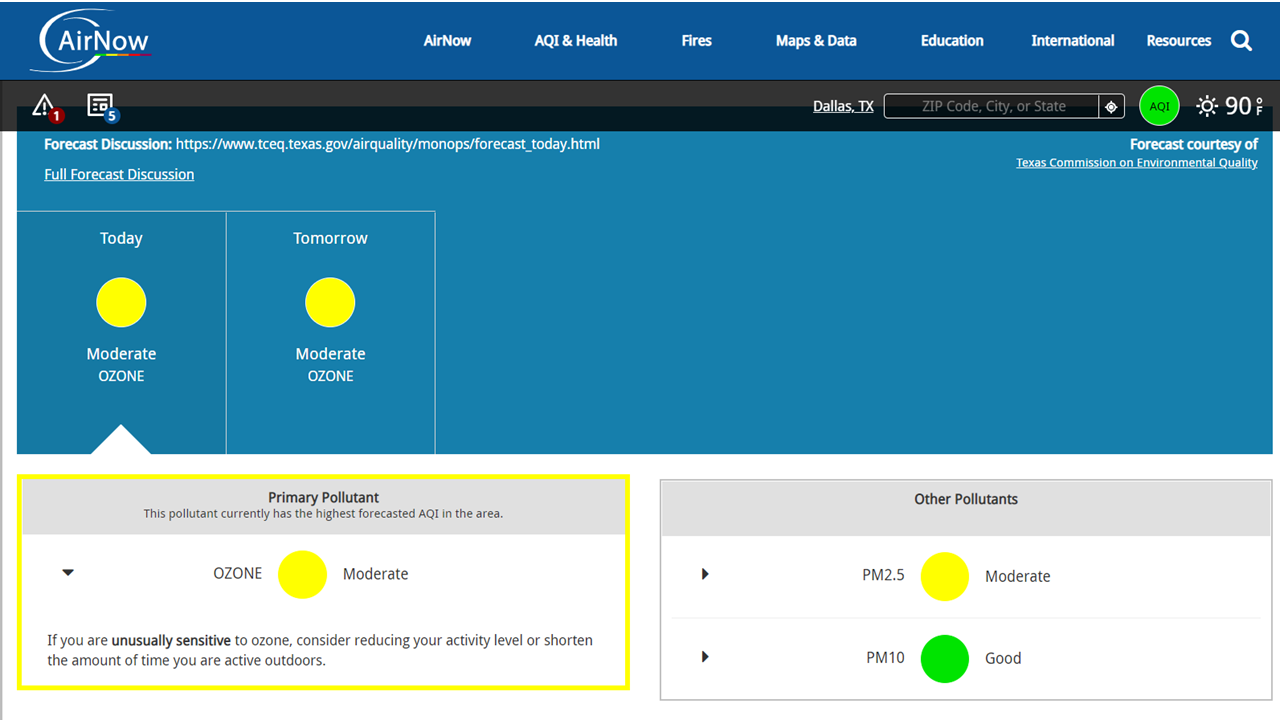
Credit: airnow.gov
Explore AirNow.gov
Try it!
Steps
- Check with your instructor on how to submit answers and how many locations to look up.
- Use the website AirNow.gov to find your local air quality quickly.
- In order to access the information you must enter your zip code for a starting point.
- After your local data is presented, you can input different locations.
- The colorful dial will point to the AQI value for the selected location.
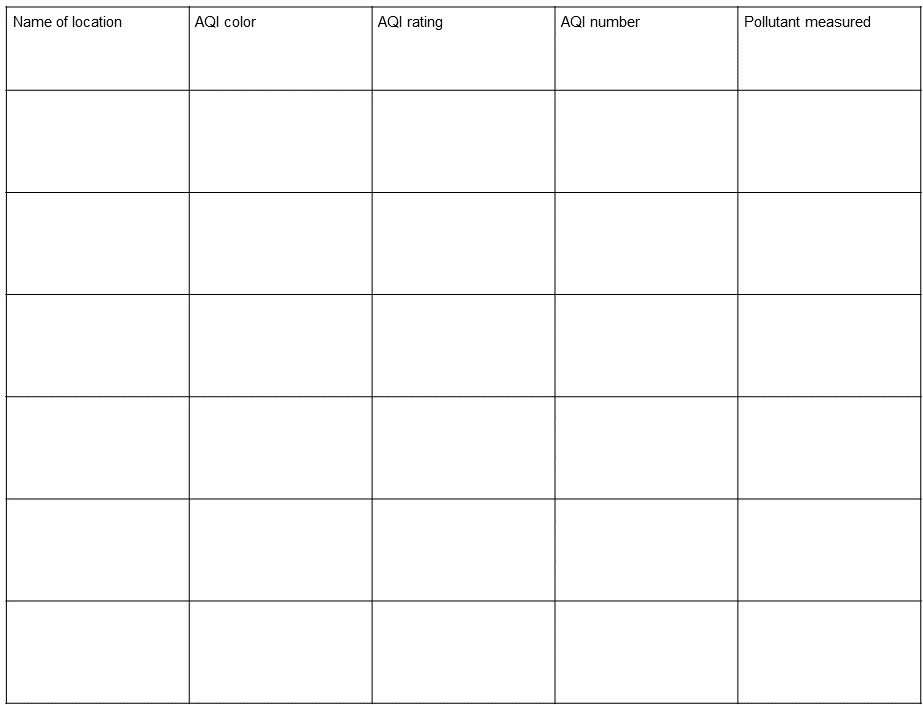
- Fill in the chart with the information for your location and others you are curious about.
- Fill in the number of location your instructor asks you to complete.
Teacher Note
Teachers, these mini lessons/student activities are perfect "warm up" tasks that can be used as a hook, bell ringer, exit slip, etc. They take less than a class period to complete. Learn more on the "My NASA Data What are Mini Lessons?" page.
Teachers who are interested in receiving the answer key, please complete the Teacher Key Request and Verification Form. We verify that requestors are teachers prior to sending access to the answer keys as we’ve had many students try to pass as teachers to gain access.