GLOBE Connections
GLOBE Connections: Earth's Energy Budget

GLOBE protocols and learning activities that complement exploration of Earth's Energy Budget are outlined.
Earth's Energy Budget
The flow of energy and matter is evident in many phenomena. These GLOBE protocols are a few examples of those that illustrate these flows. For more information on Earth's Energy Budget, visit the My NASA Data page dedicated to this concept.
Visit the GLOBE Atmosphere Protocols & Related ESDE Datasets page that outlines the datasets available in the Earth System Data Explorer. These data complement student GLOBE investigations using the following protocols.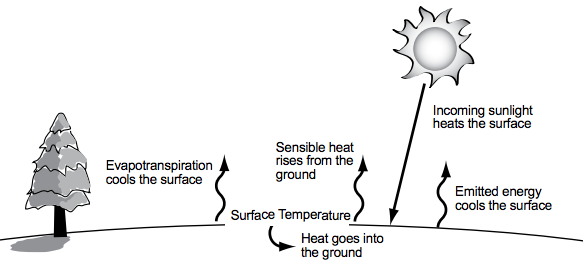
Protocols
GLOBE protocols can be used to collect many types of data to examine changing air temperatures. Students can use the protocols to collect data and share their data with other GLOBE students around the world. Students can also conduct their own investigations and see how their data related to global patterns by using GLOBE and My NASA Data together.
1. Air Temperature - Students collect current air temperature is measured using a thermometer held in the open air but in the shade for at least 3 minutes.
2. Clouds - Students observe and report which types of clouds are visible, how much of the sky is covered by clouds, and the opacity of clouds. They also report sky and surface conditions. Each observation is matched to satellite data of clouds taken about the same time and location. Cloud observations can be taken at any time! This Protocol is designed to be flexible and fit into your schedule, classifying, observing, and reporting cloud observations when it works for you. If you observe while a satellite is overhead, you can then receive an email from NASA comparing your observations to satellite data.
3. Surface Temperature - Students use an infrared thermometer (IRT) to measure the temperature of the Earth's surface.
Protocol Bundle
Urban Protocol Bundle - The purpose of the Urban Bundle is to suggest a group of GLOBE protocols that can provide students and teachers with an integrated knowledge of the environment in urban areas, including various processes and their interactions. Given the many small-scale variations caused by the built environment, such citizen science contributions are particularly needed to adequately characterize the urban environment.
GLOBE Campaign
Urban Heat Island Effect- GLOBE Surface Temperature Field Campaign focuses on looking at the impact urbanization has on the Earth’s surface temperature and how the surface temperature changes the dynamics of the Earth’s atmosphere. Studying the energy cycle is fundamental to understanding how the Earth’s spheres function within its system. The surface temperature measurements contribute data a) not normally collected by weather agencies, b) for climate studies and c) for ground-truthing satellite data.
GLOBE Educator One-Week Pacing Guide
The GLOBE Clouds and Energy Budget pacing guide provides a five day sequence of activities. It incorporates the cloud protocol and learning activities which make the connection between clouds and Earth's energy budget.
GLOBE Learning Activities:
The measurements of The GLOBE Program provide students with the means to begin exploring Earth as a System for themselves. The processes comprising the global environment are interconnected. Many of the major environmental issues of our time have driven scientists to study how these connections operate on a global basis – to understand Earth as a system. Using GLOBE Earth System Learning Activities can guide students in the development of their own personal connections with the different components of the Earth system and how these interact with each other, including the flow of energy and matter between the components.
There are many learning activities for Earth as a System. You can filter the learning activities by grade band on the GLOBE Learning Activities Search page. Select the desired grade band and click the filter button.
How Do Seasonal Temperature Patterns Vary Among Different Regions of the World?
![]()
![]()
![]()
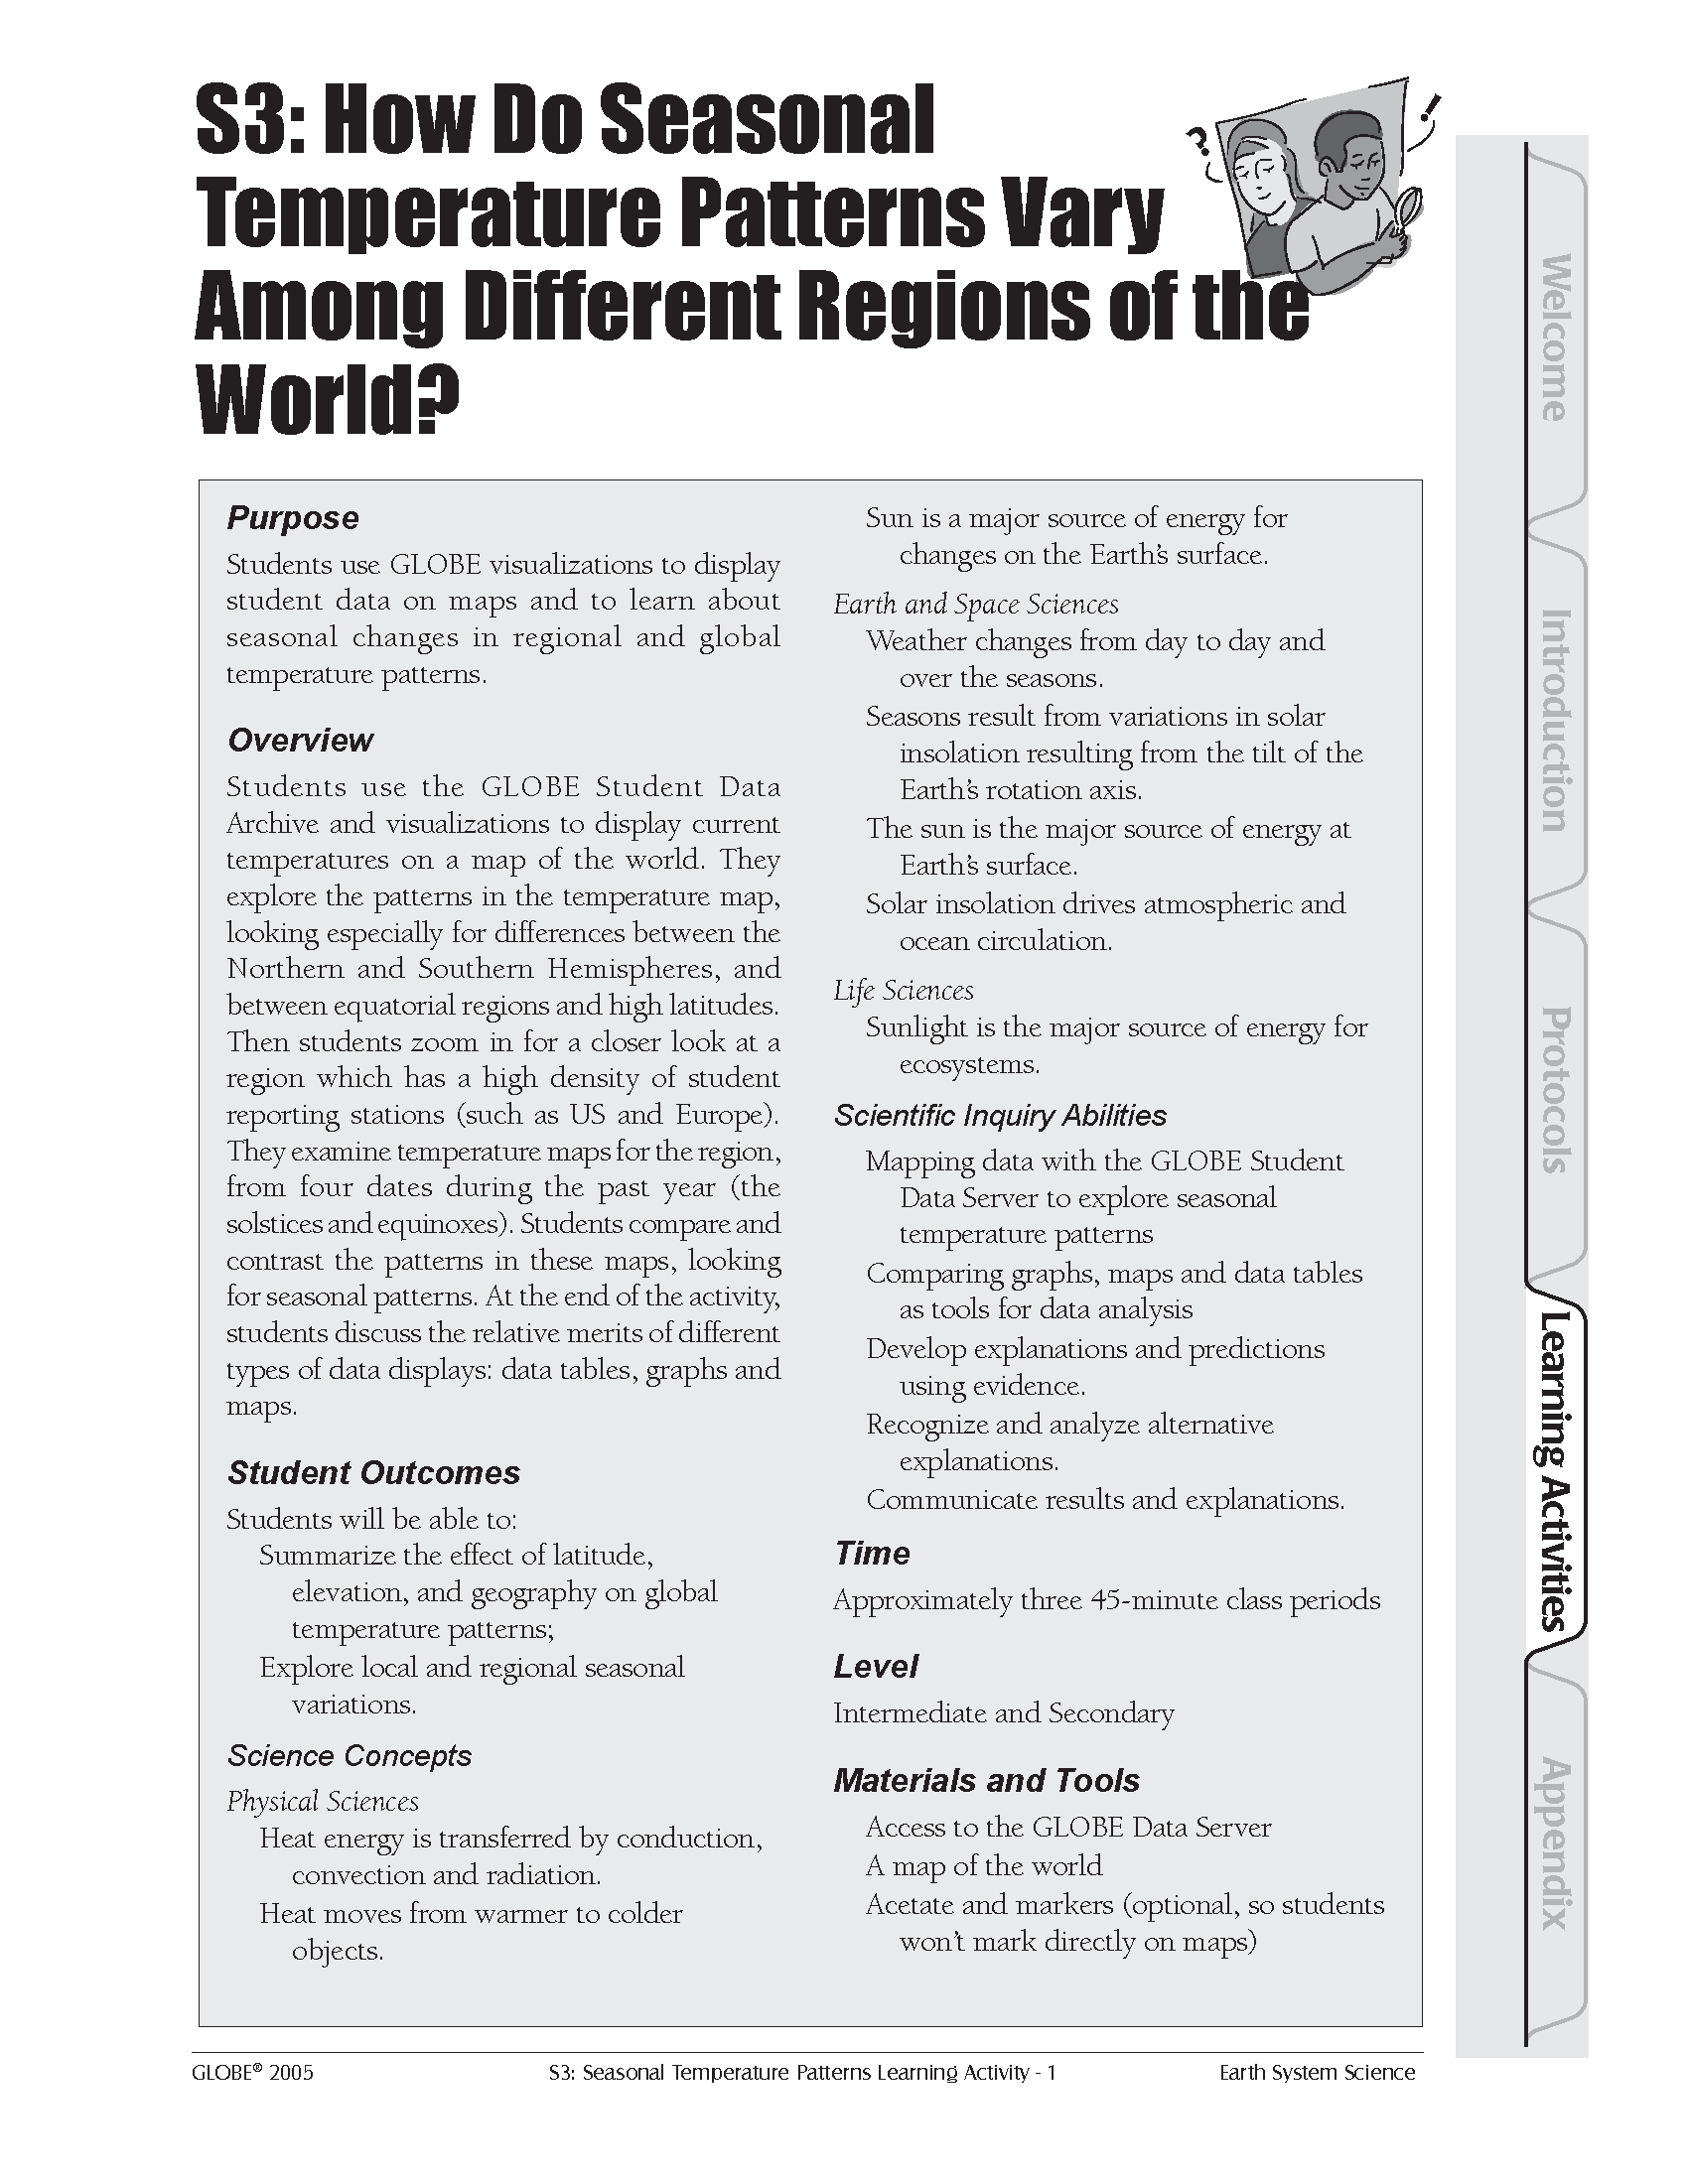
Overview: Students use the GLOBE Student Data Archive and visualizations to display current temperatures on a map of the world. They explore the patterns in the temperature map, looking especially for differences between the Northern and Southern Hemispheres, and between equatorial regions and high latitudes. Then students zoom in for a closer look at a region that has a high density of student reporting stations (such as the US and Europe). They examine temperature maps for the region, from four dates during the past year (the solstices and equinoxes). Students compare and contrast the patterns in these maps, looking for seasonal patterns. At the end of the activity, students discuss the relative merits of different types of data displays: data tables, graphs, and maps.
Student Outcomes:
- Summarize the effect of latitude, elevation, and geography on global temperature patterns
- Explore local and regional seasonal variations
- Heat energy is transferred by conduction, convection, and radiation
- Heat moves from warmer to colder objects
- Sun is a major source of energy for changes on the Earth’s surface
- Weather changes from day to day and over the seasons
- Seasons result from variations in solar insolation resulting from the tilt of the Earth’s rotation axis
- The sun is the major source of energy at Earth’s surface
- Solar insolation drives atmospheric and ocean circulation
- Sunlight is the major source of energy for ecosystems
- Mapping data with the GLOBE Student Data Server to explore seasonal temperature patterns
- Comparing graphs, maps and data tables as tools for data analysis
- Develop explanations and predictions using evidence
- Recognize and analyze alternative explanations
- Communicate results and explanations
Regional Connections-Effects of Inputs and Outputs on a Region: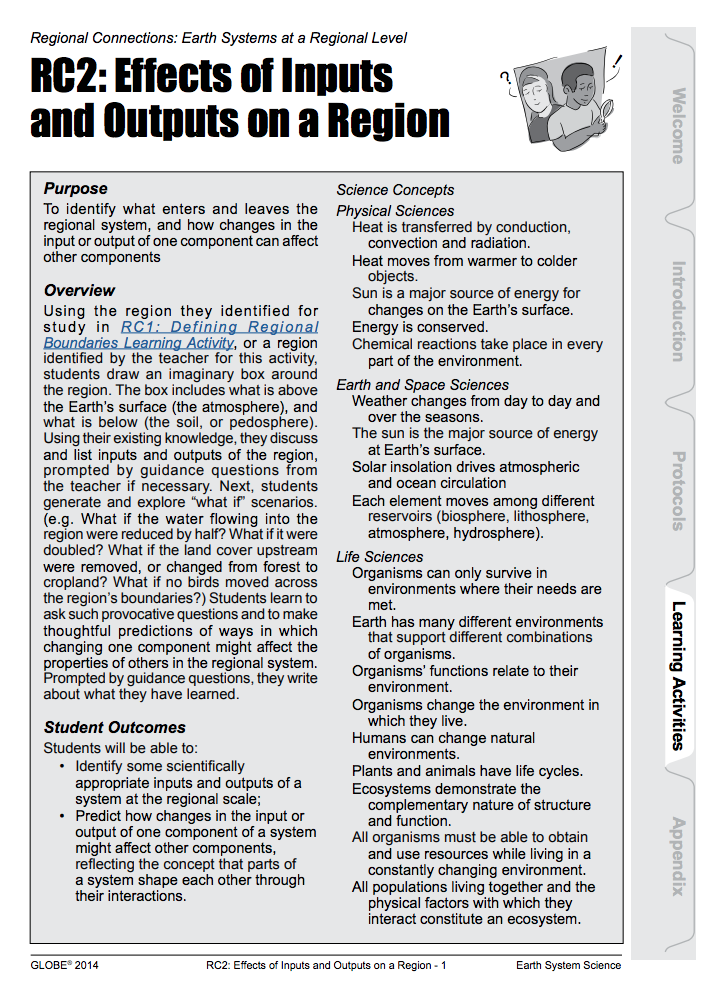
Overview: Using the region they identified for study in RC1: Defining Regional Boundaries Learning Activity, or a region identified by the teacher for this activity, students draw an imaginary box around the region. The box includes what is above the Earth’s surface (the atmosphere), and what is below (the soil, or pedosphere). Using their existing knowledge, they discuss and list the inputs and outputs of the region, prompted by guidance questions from the teacher if necessary. Next, students generate and explore “what if” scenarios. (e.g. What if the water flowing into the region was reduced by half? What if it were doubled? What if the land cover upstream were removed, or changed from forest to cropland? What if no birds moved across the region’s boundaries?) Students learn to ask such provocative questions and to make thoughtful predictions of ways in which changing one component might affect the properties of others in the regional system. Prompted by guidance questions, they write about what they have learned.
Student Outcomes:
- Identify some scientifically appropriate inputs and outputs of a system at the regional scale;
- Predict how changes in the input or output of one component of a system might affect other components, reflecting the concept that parts of a system shape each other through their interactions.
What Can We Learn About Our Seasons? 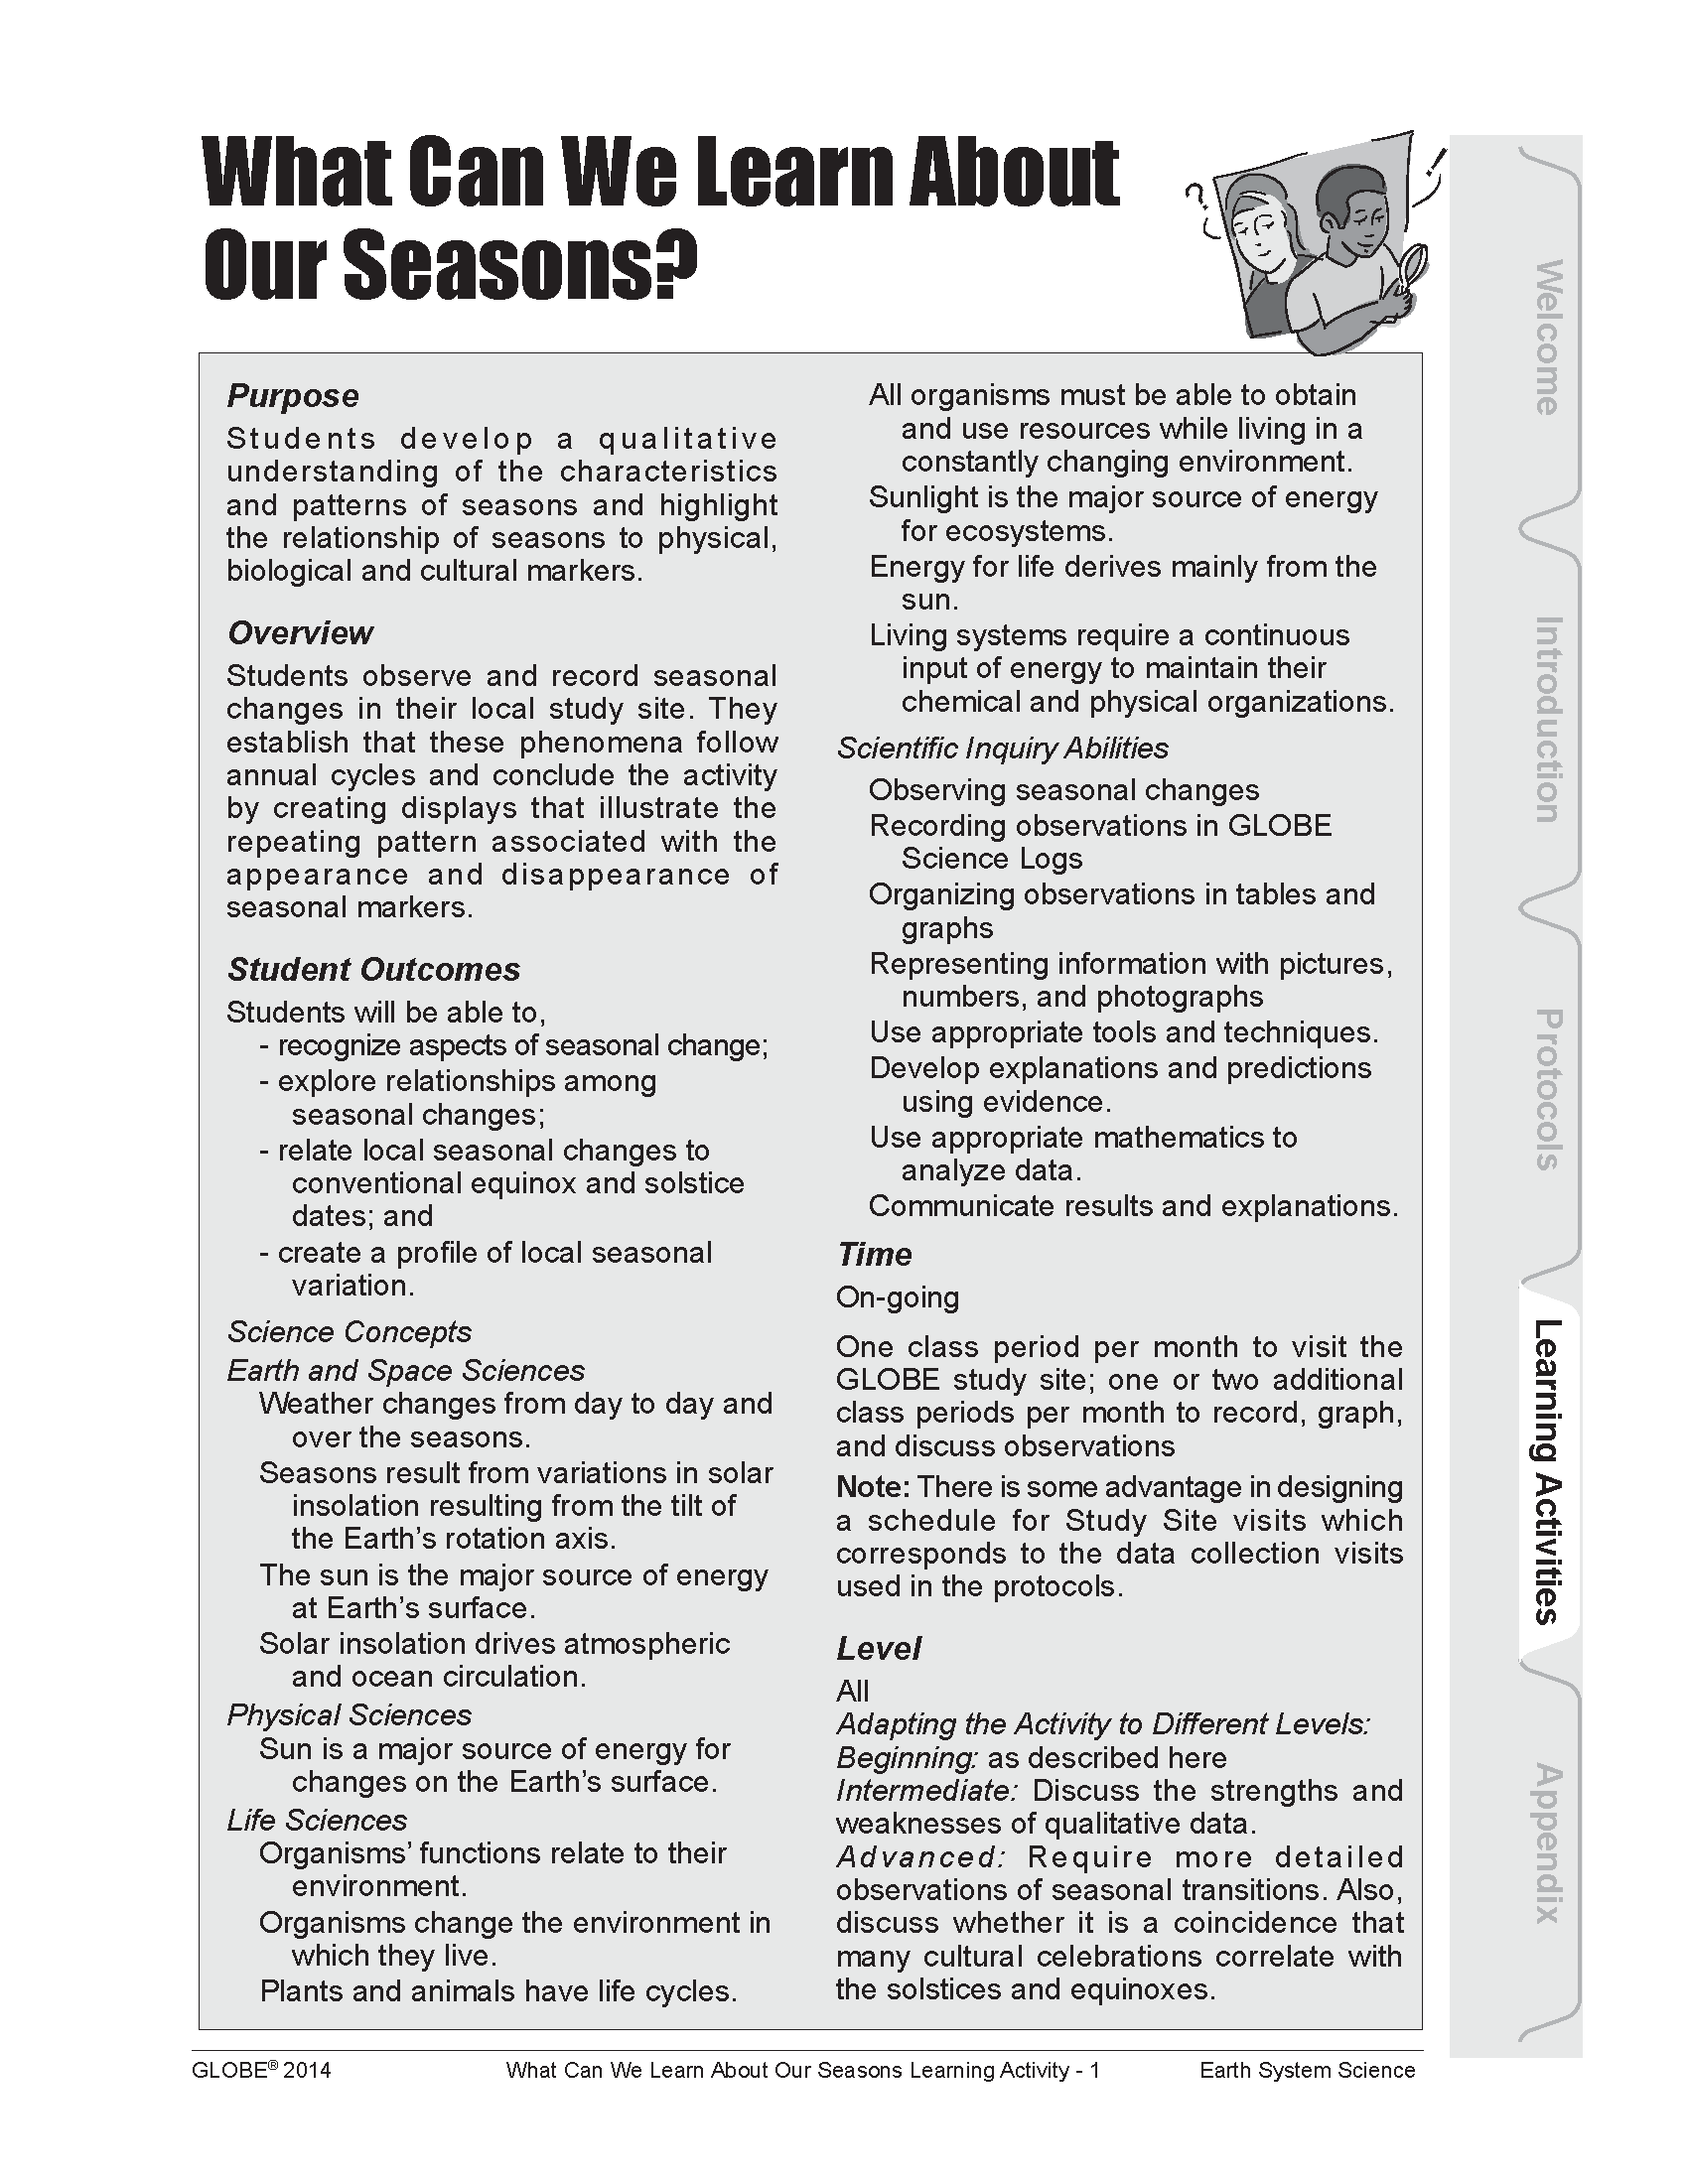
Overview: Students observe and record seasonal changes in their local study site. They establish that these phenomena follow annual cycles and conclude the activity by creating displays that illustrate the repeating pattern associated with the appearance and disappearance of seasonal markers.
Student Outcomes:
- recognize aspects of seasonal change
- explore relationships among seasonal changes
- relate local seasonal changes to conventional equinox and solstice dates
- create a profile of local seasonal variation