List of all Hydrosphere Lesson Plans

all grade icon
elementary grade icon
middle grade icon
high grade icon
Grade Level: 6-8

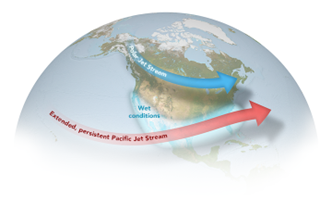
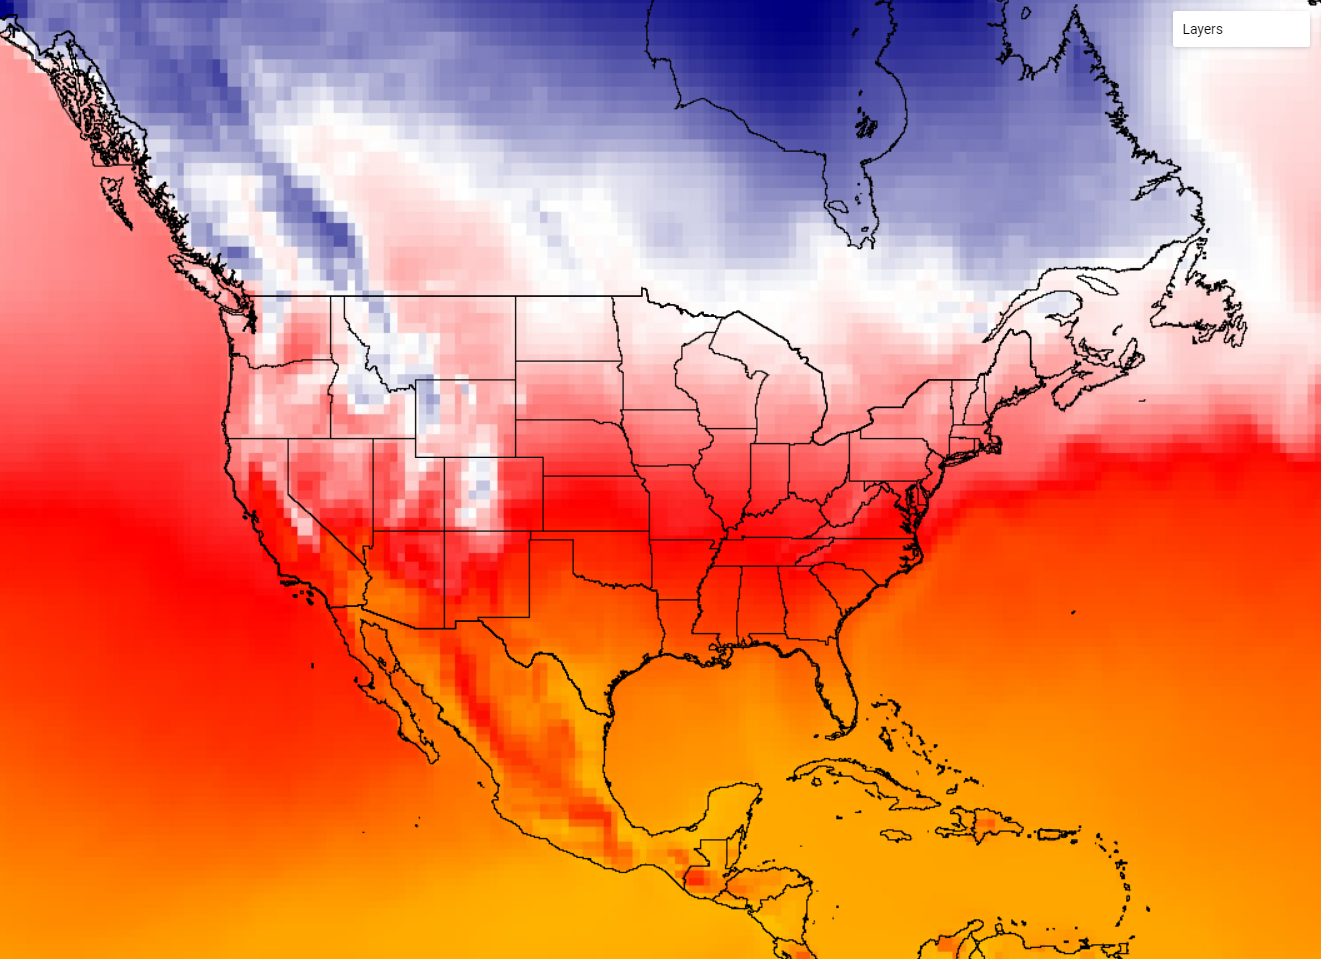
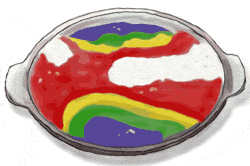
In this activity, students will analyze a NASA sea surface height model of El Niño for December 27, 2015, and answer questions. Then they will be instructed to create a model of their own made from pudding to reflect the layers of El Niño.

Grade Level: 3-5, 6-8, 9-12

The Earth System Satellite Images, help the learner visualize how different Earth system variables change over time, establish cause and effect relationships for a specific variable, identify patterns, and determine relationships among variables over one year.

Grade Level: 3-5, 6-8, 9-12

The Earth System Satellite Images, along with the Data Literacy Cubes, help the learner visualize how different Earth system variables change over time, establish cause and effect relationships, identify patterns, and determine relationships among variables.  

Grade Level: 6-8, 9-12

Students will explore the relationship between Nitrogen Dioxide and Precipitation in Earth's atmosphere. They will explore the data provided, make a claim, and complete a slide guided by a rubric.

Grade Level: 6-8

The El Niño Implementation Sequence provides a series of lessons and activities for students to learn about a condition that sometimes occurs in the Pacific Ocean, but it is so big that it affects weather all over the world.

Grade Level: 3-5, 6-8, 9-12

The Earth System Satellite Images, along with the Data Literacy Cubes, helps the learner identify patterns in a specific image.  

These NASA lessons support Next Generation Science Standards (NGSS) and three dimensional learning of the Earth System. These include activities where students interact with NASA maps, graphs, and datasets from the atmosphere, biosphere, cryosphere, geosphere, hydrosphere and the earth system.