
Grade Level: 6-8,
9-12
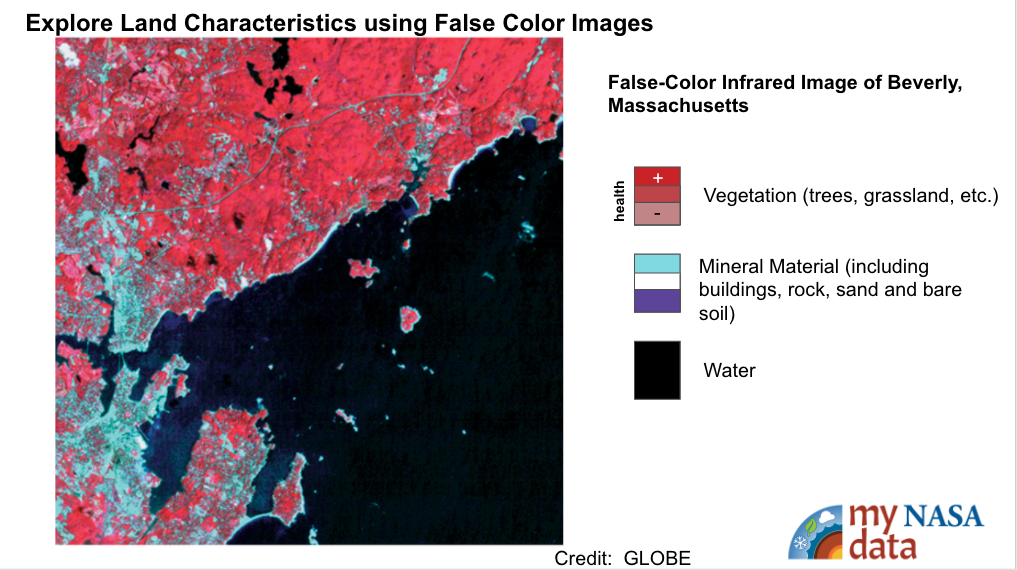
This lesson walks students through the use of Landsat false-color imagery and identification of different land cover features using these as models.


This lesson walks students through the use of Landsat false-color imagery and identification of different land cover features using these as models.
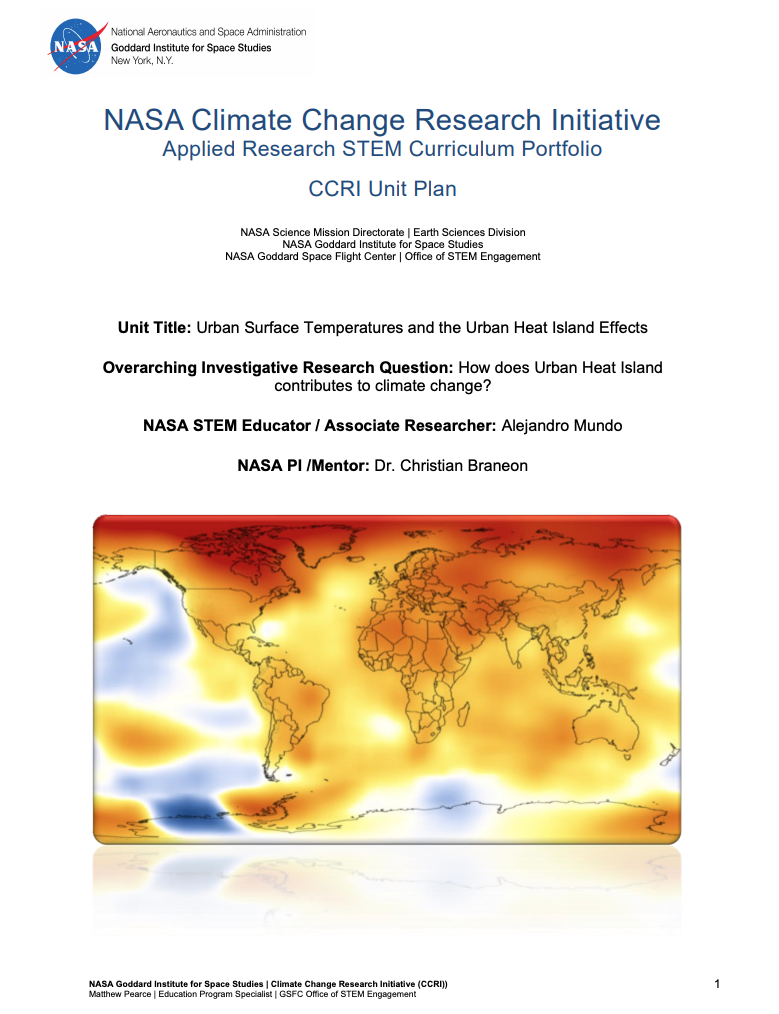
This unit plan is published by the NASA Climate Change Research Initiative's (CCRI) Applied Research STEM Curriculum Portfolio. The CCRI Unit Plan, called “Urban Surface Temperatures and the Urban Heat Island Effects,“ has the purpose to educate students how climate is changi

Learners follow adventurous camper, Awenasa, as she travels the United States and attends various camp locations throughout the year. Learners analyze data to find her location among the various campsites using monthly averaged NASA satellite data (Cloud Coverage, Surface (S
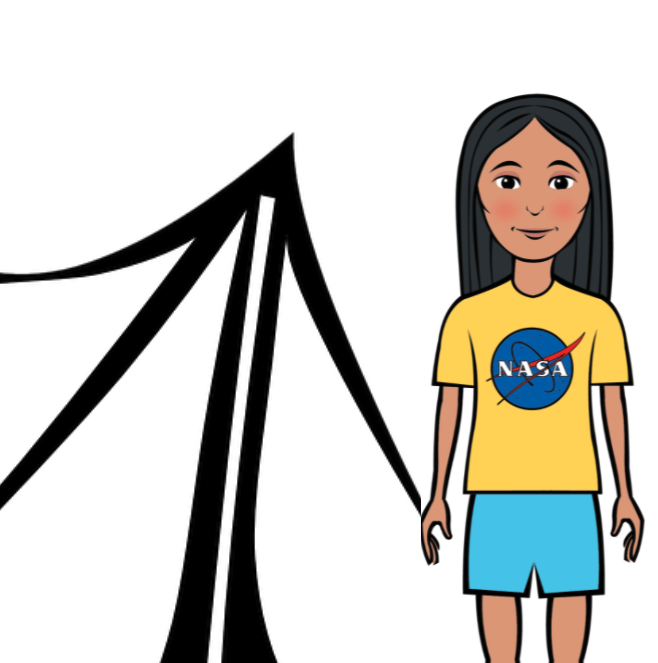
This lesson, "Awenasa Goes to Camp!," is a data analysis activity that presents maps of NASA Earth satellite data for a variety of locations across the United States for four unidentified months throughout the year. Each location represents a real science camp th
Students collect and analyze temperature data to explore what governs how much energy is reflected.
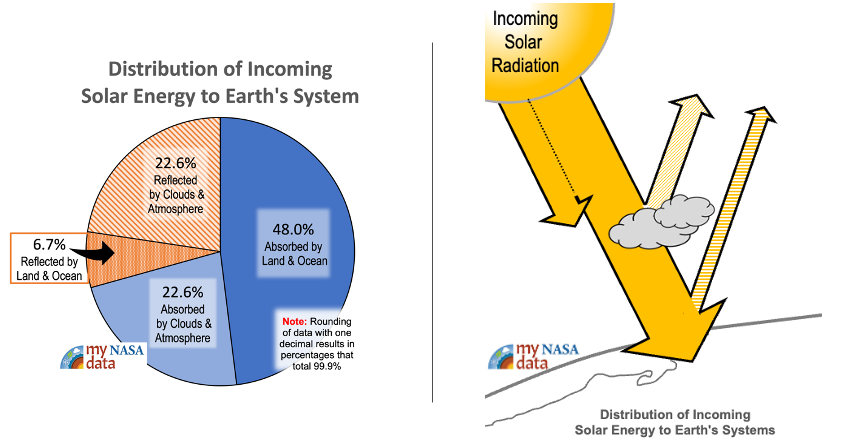
A kinesthetic activity that challenges students to participate in a model that describes the fate of solar energy as it enters the Earth system. A good initial lesson for Earth’s energy budget, students unravel the benefits and limitations of their model.
Students will examine how radiation, conduction, and convection work together as a part of Earth’s Energy Budget to heat the atmosphere.
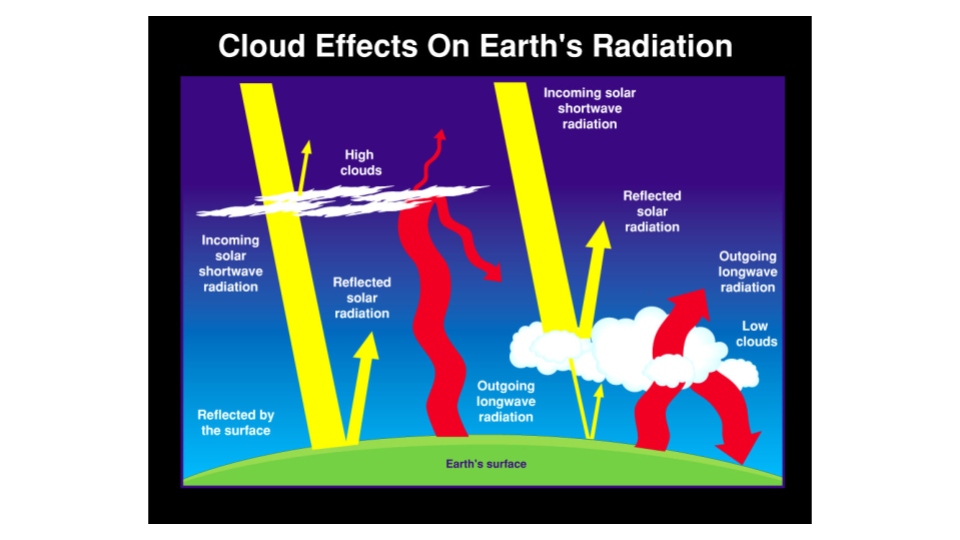
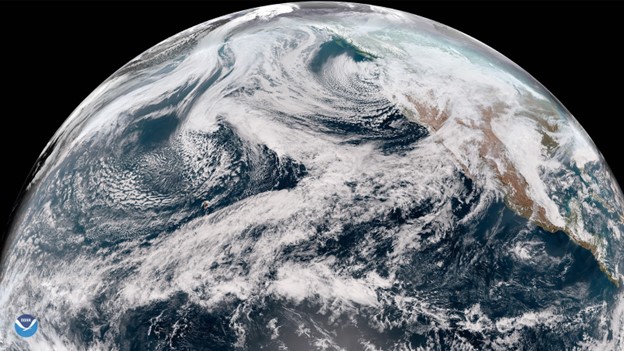
Students will investigate the role of clouds and their contribution (if any) to global warming. Working in cooperative groups, students will make a claim about the future role clouds will play in Earth’s Energy Budget if temperatures continue to increase.
Students visit a NASA Website called "Eyes on the Earth" to view satellite missions in 3D circling the Earth and learn to navigate to specific satellites to learn about their capability of analyzing our changing planet and air quality.
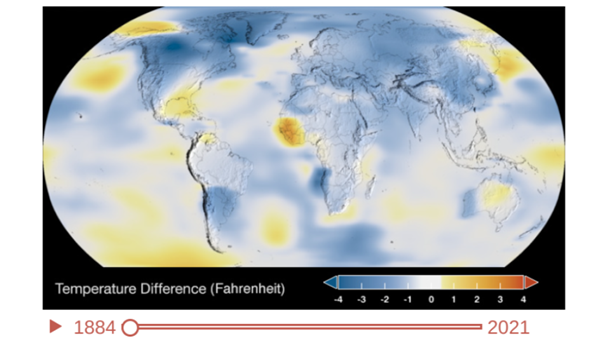
Students will watch and examine a NASA animation of Earth’s rising surface temperatures over an almost 150 year period.
These NASA lessons support Next Generation Science Standards (NGSS) and three dimensional learning of the Earth System. These include activities where students interact with NASA maps, graphs, and datasets from the atmosphere, biosphere, cryosphere, geosphere, hydrosphere and the earth system.
