GLOBE Connections
GLOBE Connections: Scale, Proportion and Quantity

Scale, Proportion, and Quantity
GLOBE protocols help students to study and model phenomena that are too large or small to directly observe, such as change over time and space. Many GLOBE protocols can be used to study changes over time. These changes would include seasonal, as well as long term changes. In addition, data can be retrieved and examined on local, regional and global scales. A few of the protocols and learning activities that especially highlight these ideas are outlined on this page. For information on all GLOBE protocols, see the Do GLOBE page on the GLOBE website.
For more information on Scale, Proportion, and Quantity, visit the My NASA Data page dedicated to this cross-cutting concept.
Protocols
Carbon Cycle The Globe Carbon Cycle project is one of four Earth System Science Projects (ESSPs) funded by NASA and NSF to develop hands-on, intermediate, and secondary school-based science activities for the GLOBE Program.
GLOBE Carbon Cycle is focused on bringing the most cutting-edge research and research techniques in the field of terrestrial ecosystem carbon cycling into the classroom. It uses a systems-thinking approach to gain a foundation in the carbon cycle and its relation to climate and energy. The materials incorporate a diverse set of activities geared toward upper-middle and high school students. The protocols are found on the GLOBE Biosphere Protocols Teacher's Guide page.
Land Cover Classification: Determine the major land cover type at a Land Cover Sample Site.
Learning Activities
Overview: In this activity, students will calculate the biomass of their classroom using an estimate of the total dry mass of students in the class as well as the classroom area. Students calculate current carbon storage in the classroom. Students consider vegetation biomass across global biomes.
Student Outcomes:
- Determine the biomass of the classroom by calculating the total students’ dry mass within the classroom area.
- Calculate differences in classroom biomass when the classroom area or students’ dry mass changes.
- Investigate and discuss connections between basic biomass concepts (mass/ area) and the amount of biomass in natural systems (biomes).
Global Connections (GC2) -Components of the Earth System Working Together:
Overview: Students review a variety of images and maps of the whole Earth in order to identify the major components of the Earth system on a global scale. The maps show solar energy, average temperature, cloud cover, precipitation, soil moisture, and vegetation, and the images are of the Earth from space. As a class, they discuss some ways that the components of the Earth system interact to form the whole Earth system. They describe the water cycle at the global scale in greater detail, identify the components through which water passes and the processes that move it, and draw an abstract diagram.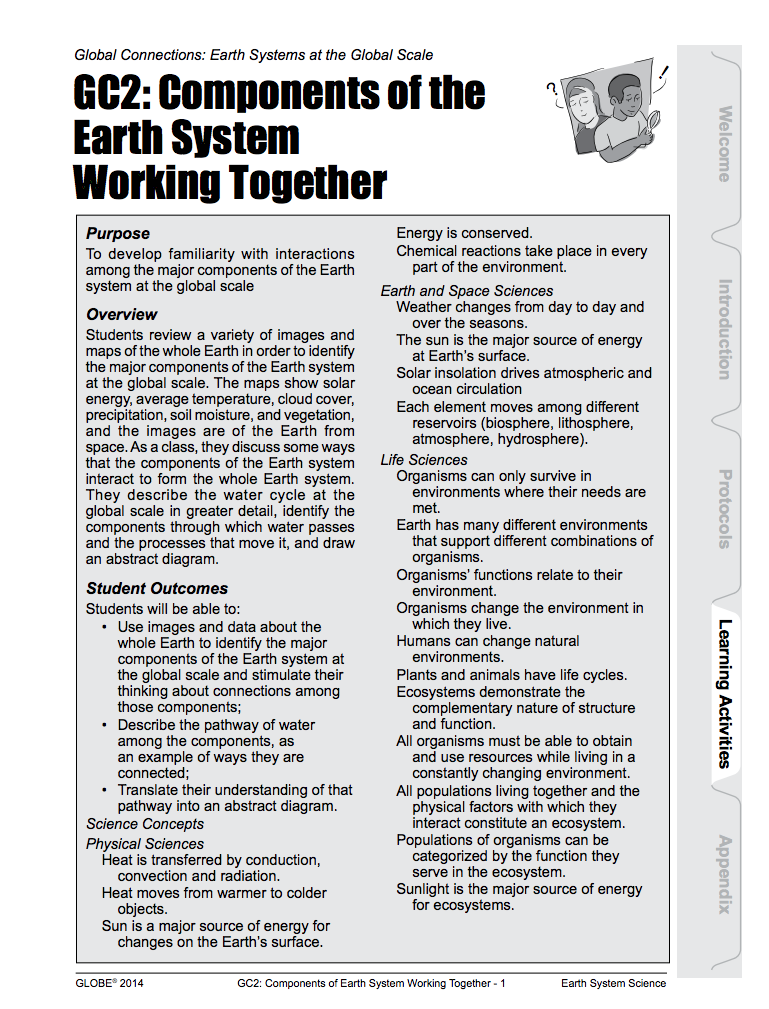
Student Outcomes:
- Use images and data about the whole Earth to identify the major components of the Earth system at the global
scale and stimulate their thinking about connections among those components - Describe the pathway of water among the components, as an example of ways they are connected
- Translate their understanding of that pathway into an abstract diagram
Determining Scale and Calculating Area
Overview: Students will determine a scale for the aerial photo or map they are using to investigate their carbon cycle sample site. The map scale is then used to calculate a given area, such as that of forest in the schoolyard. A vegetated area is required to make an estimate of the total above-ground carbon stock within the schoolyard or other desired location, which may be needed for a variety of research questions. Calculating area can be done using several methods; these range from a paper map and grid, as described here, to a more complex geographic information system (GIS) and image analysis techniques.
Student Outcomes:
- Use an aerial photo or map, a tape measure, and math to determine scale.
- Calculate the area of a real-world object using a map scale and a gridded overlay.
- Develop and implement a method to determine carbon stocks in the vegetated areas of the schoolyard or other desired location.
(Source: GLOBE Determining Scale and Calculating Area)
Overview: Using Multispec software, evaluate and investigate changes that have occurred in the major land cover types of your GLOBE Study Site by examining the digital files of two Landsat satellite images that were acquired a few years apart.
Image Credit: NASA
Student Outcomes:
- Earth has many different environments that support different combinations of organisms
- All organisms must be able to obtain and use resources while living in a constantly changing environment
- All populations living together and the physical factors with which they interact constitute an ecosystem
- Humans can change ecosystem balance
- How to use maps (real and imaginary)
- The characteristics and spatial distribution of ecosystems
- Use land cover data and appropriate tools and technology to interpret change
- Gather spatial data and historical data to determine the validity of change hypotheses
Odyssey of the Eyes
Overview: Students explore the importance of perspective and are introduced to various scales of remotely-sensed data.
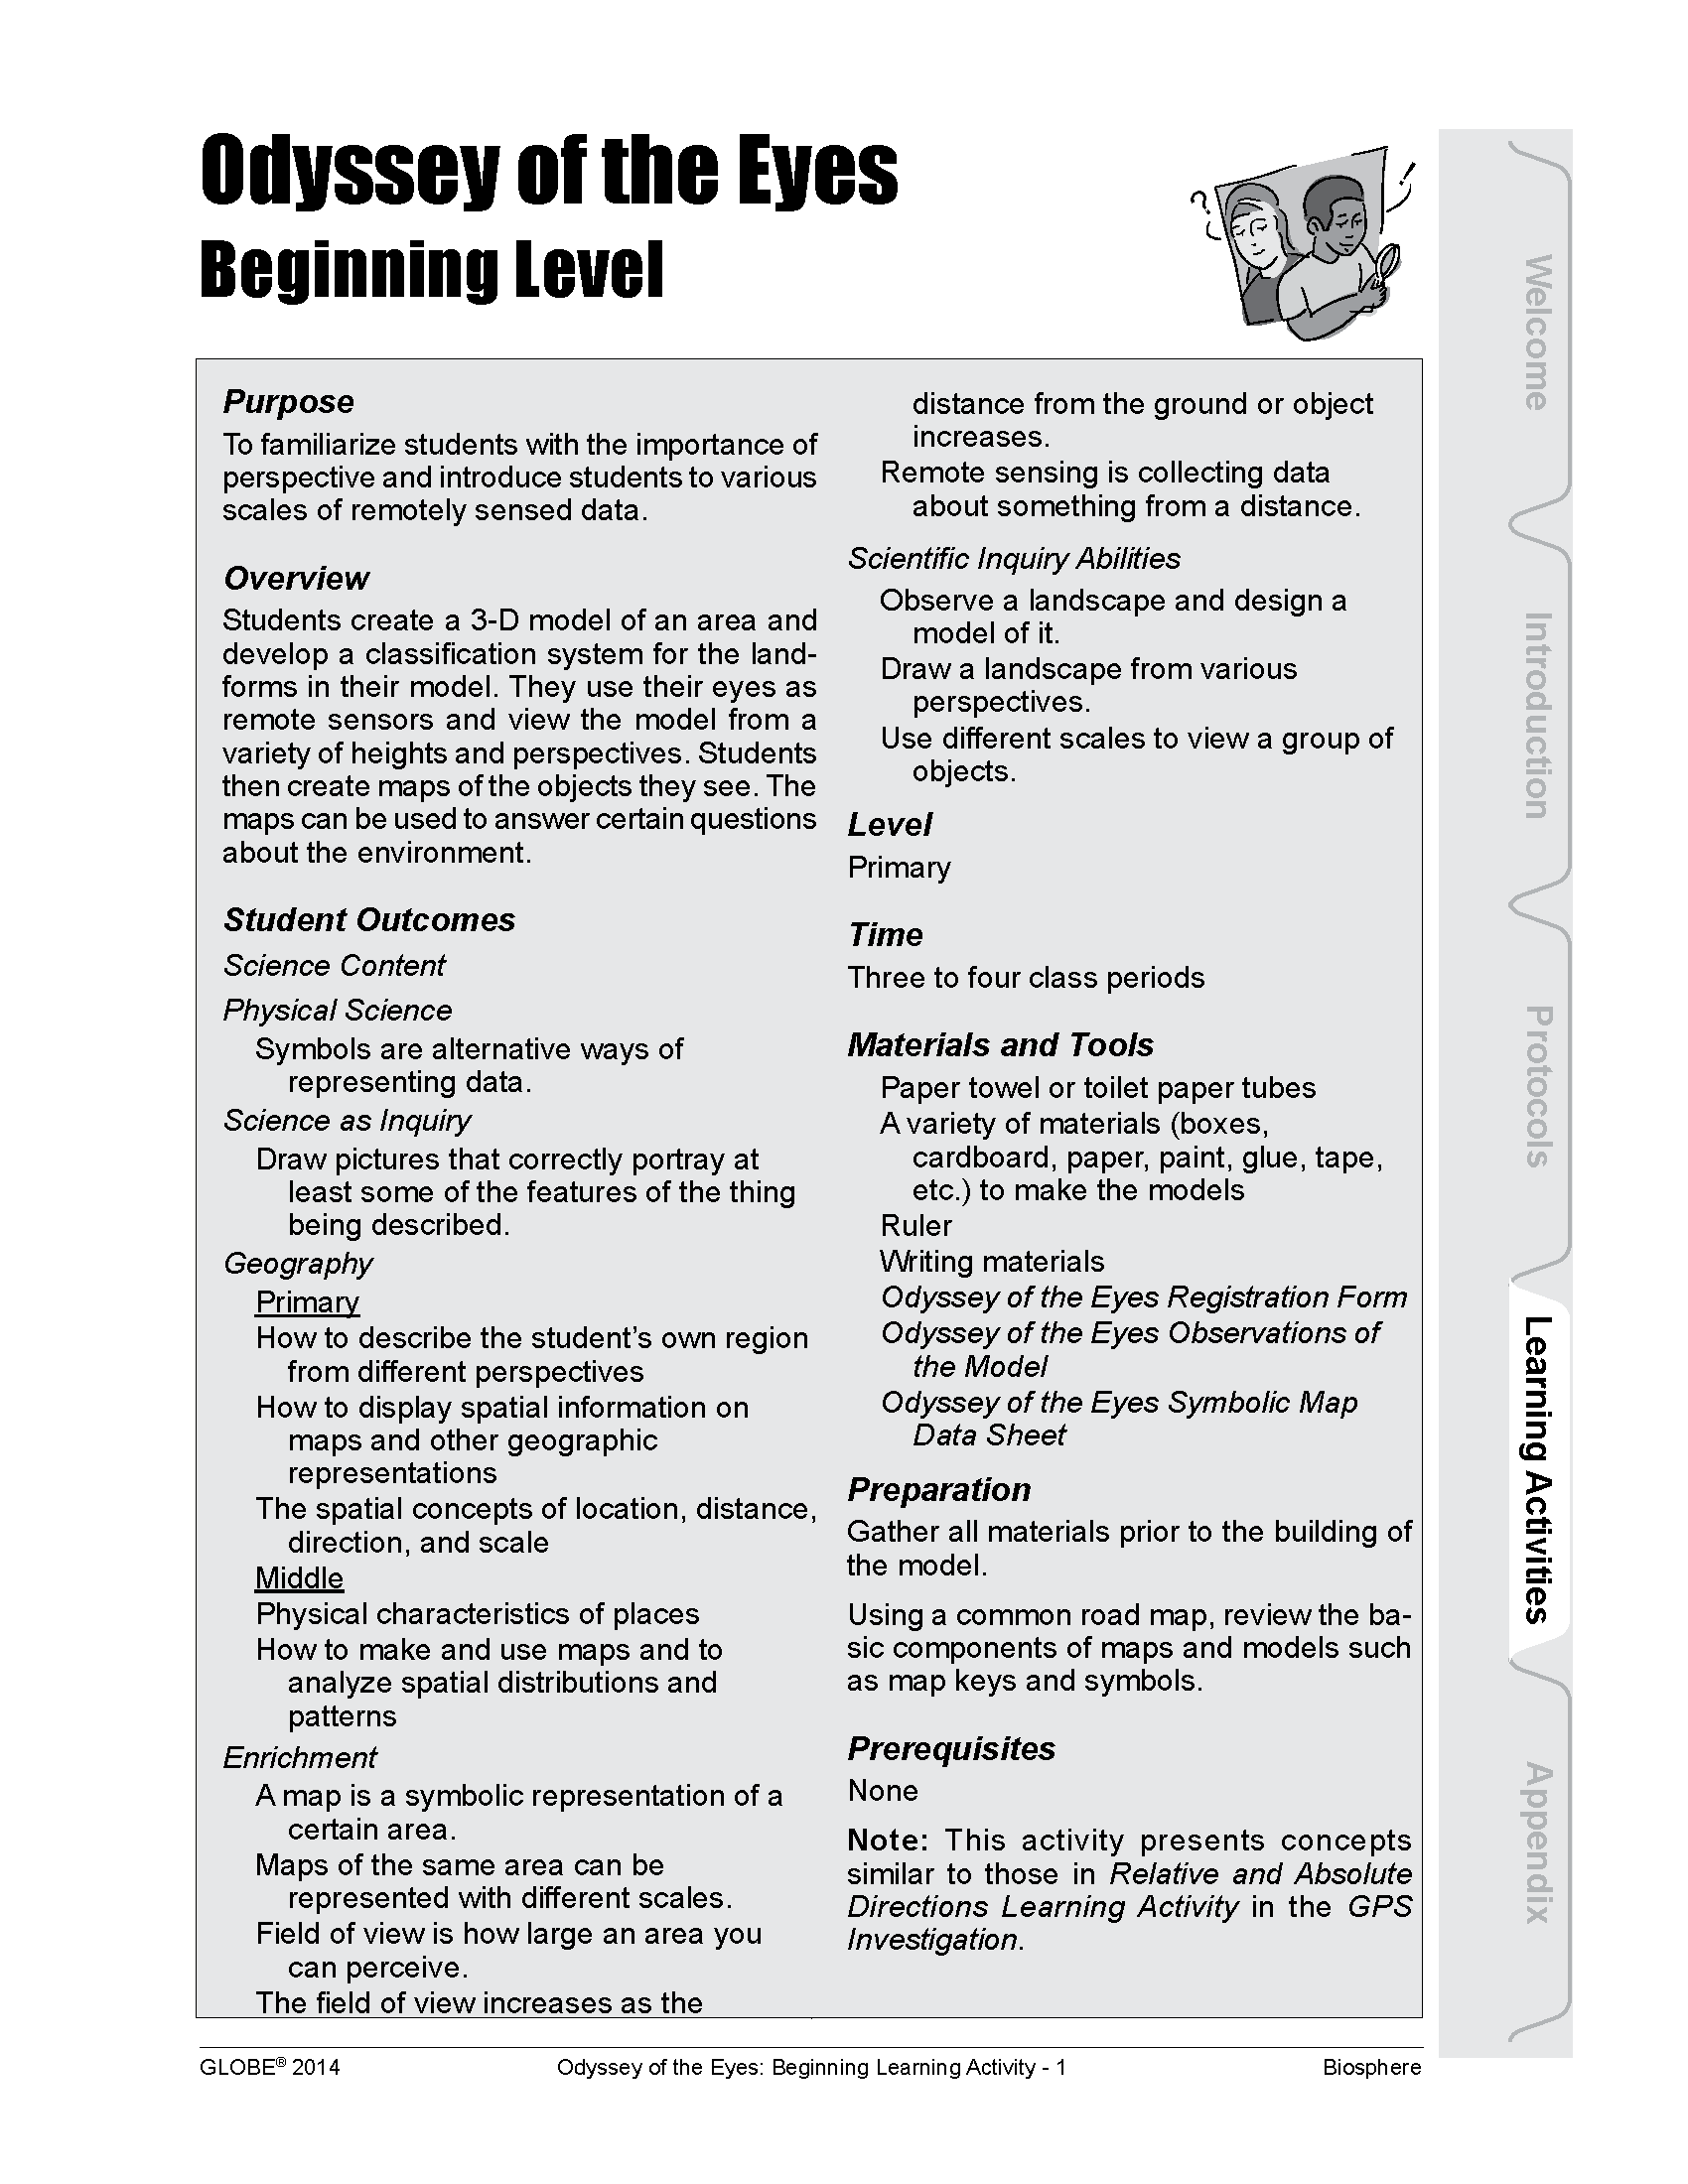
Source: (GLOBE Website)
Student Outcomes:
- Symbols are alternative ways of representing data
- Draw pictures that correctly portray at least some of the features of the thing being described
- How to describe the student’s own region from different perspectives
- How to display spatial information on maps and other geographic representations
- The spatial concepts of location, distance, direction, and scale
- Physical characteristics of places
- How to make and use maps and to analyze spatial distributions and patterns
Overview: Students explore the concept of modeling as it relates to remote sensing and to the process of digitizing images.
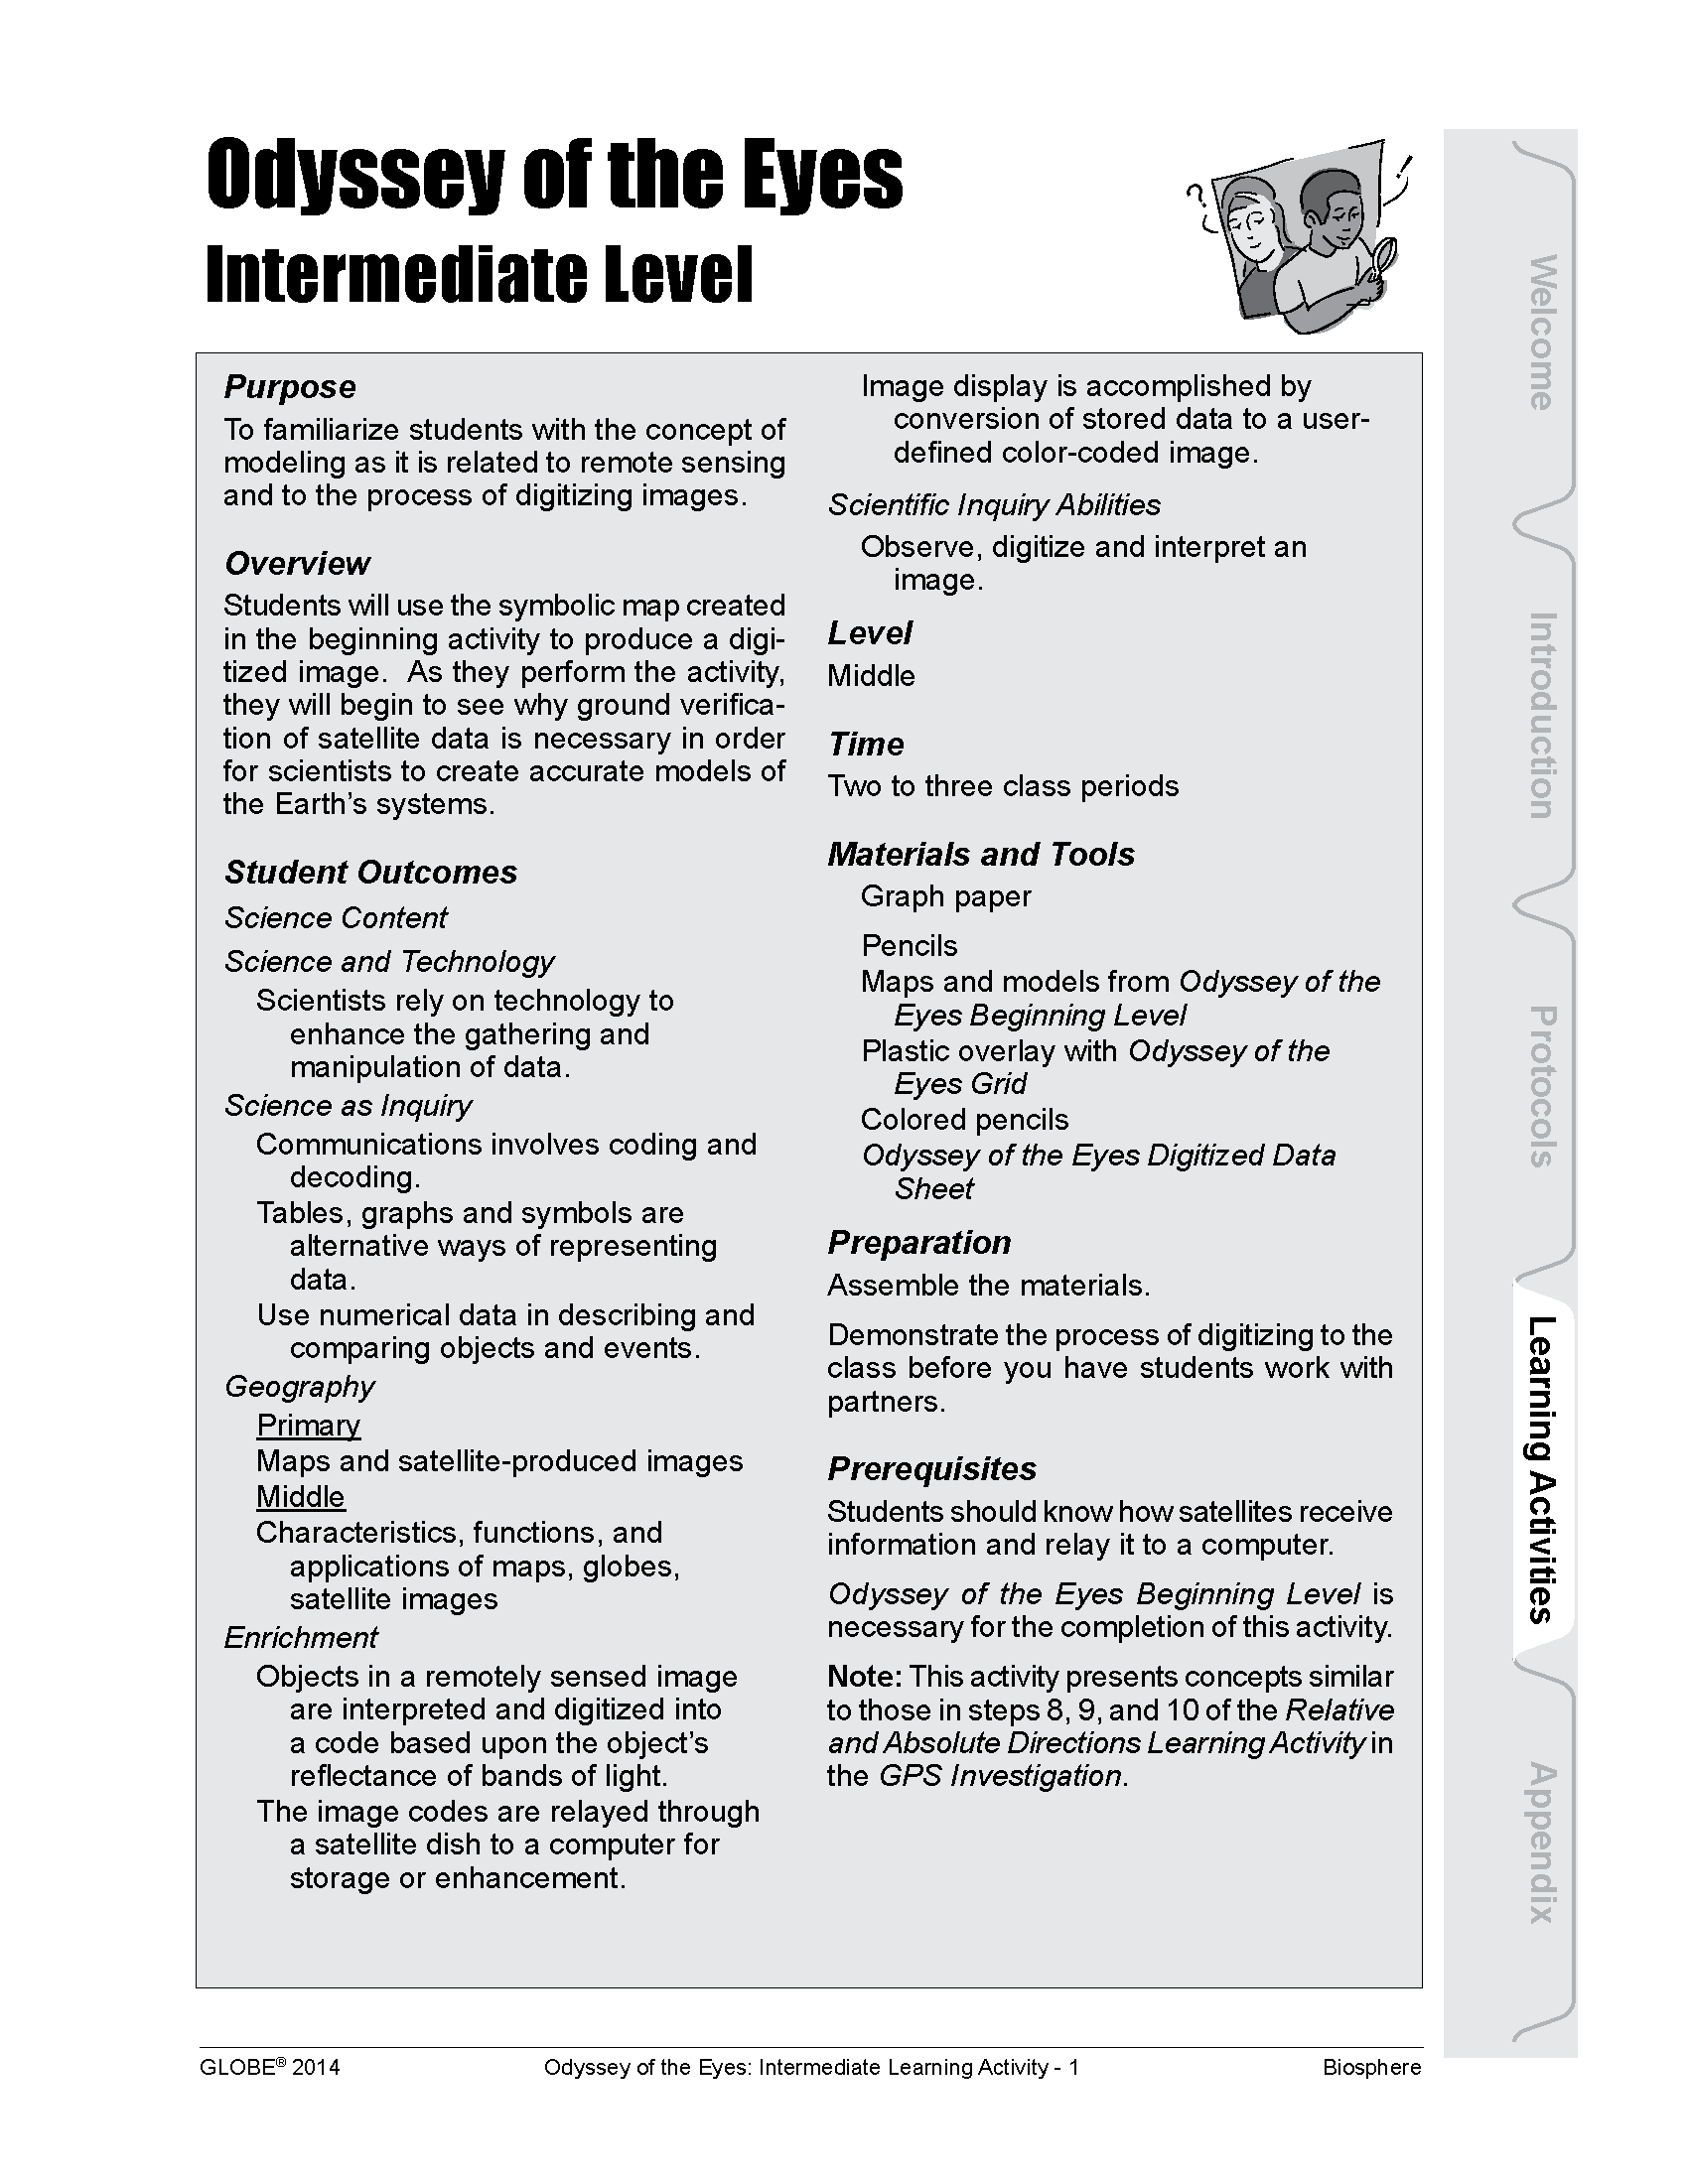
Source: (GLOBE Website)
Student Outcomes:
- Scientists rely on technology to enhance the gathering and manipulation of data
- Tables, graphs, and symbols are alternative ways of representing data
- Use numerical data in describing and comparing objects and events
- Maps and satellite-produced images
- Characteristics, functions, and applications of maps, globes, satellite images
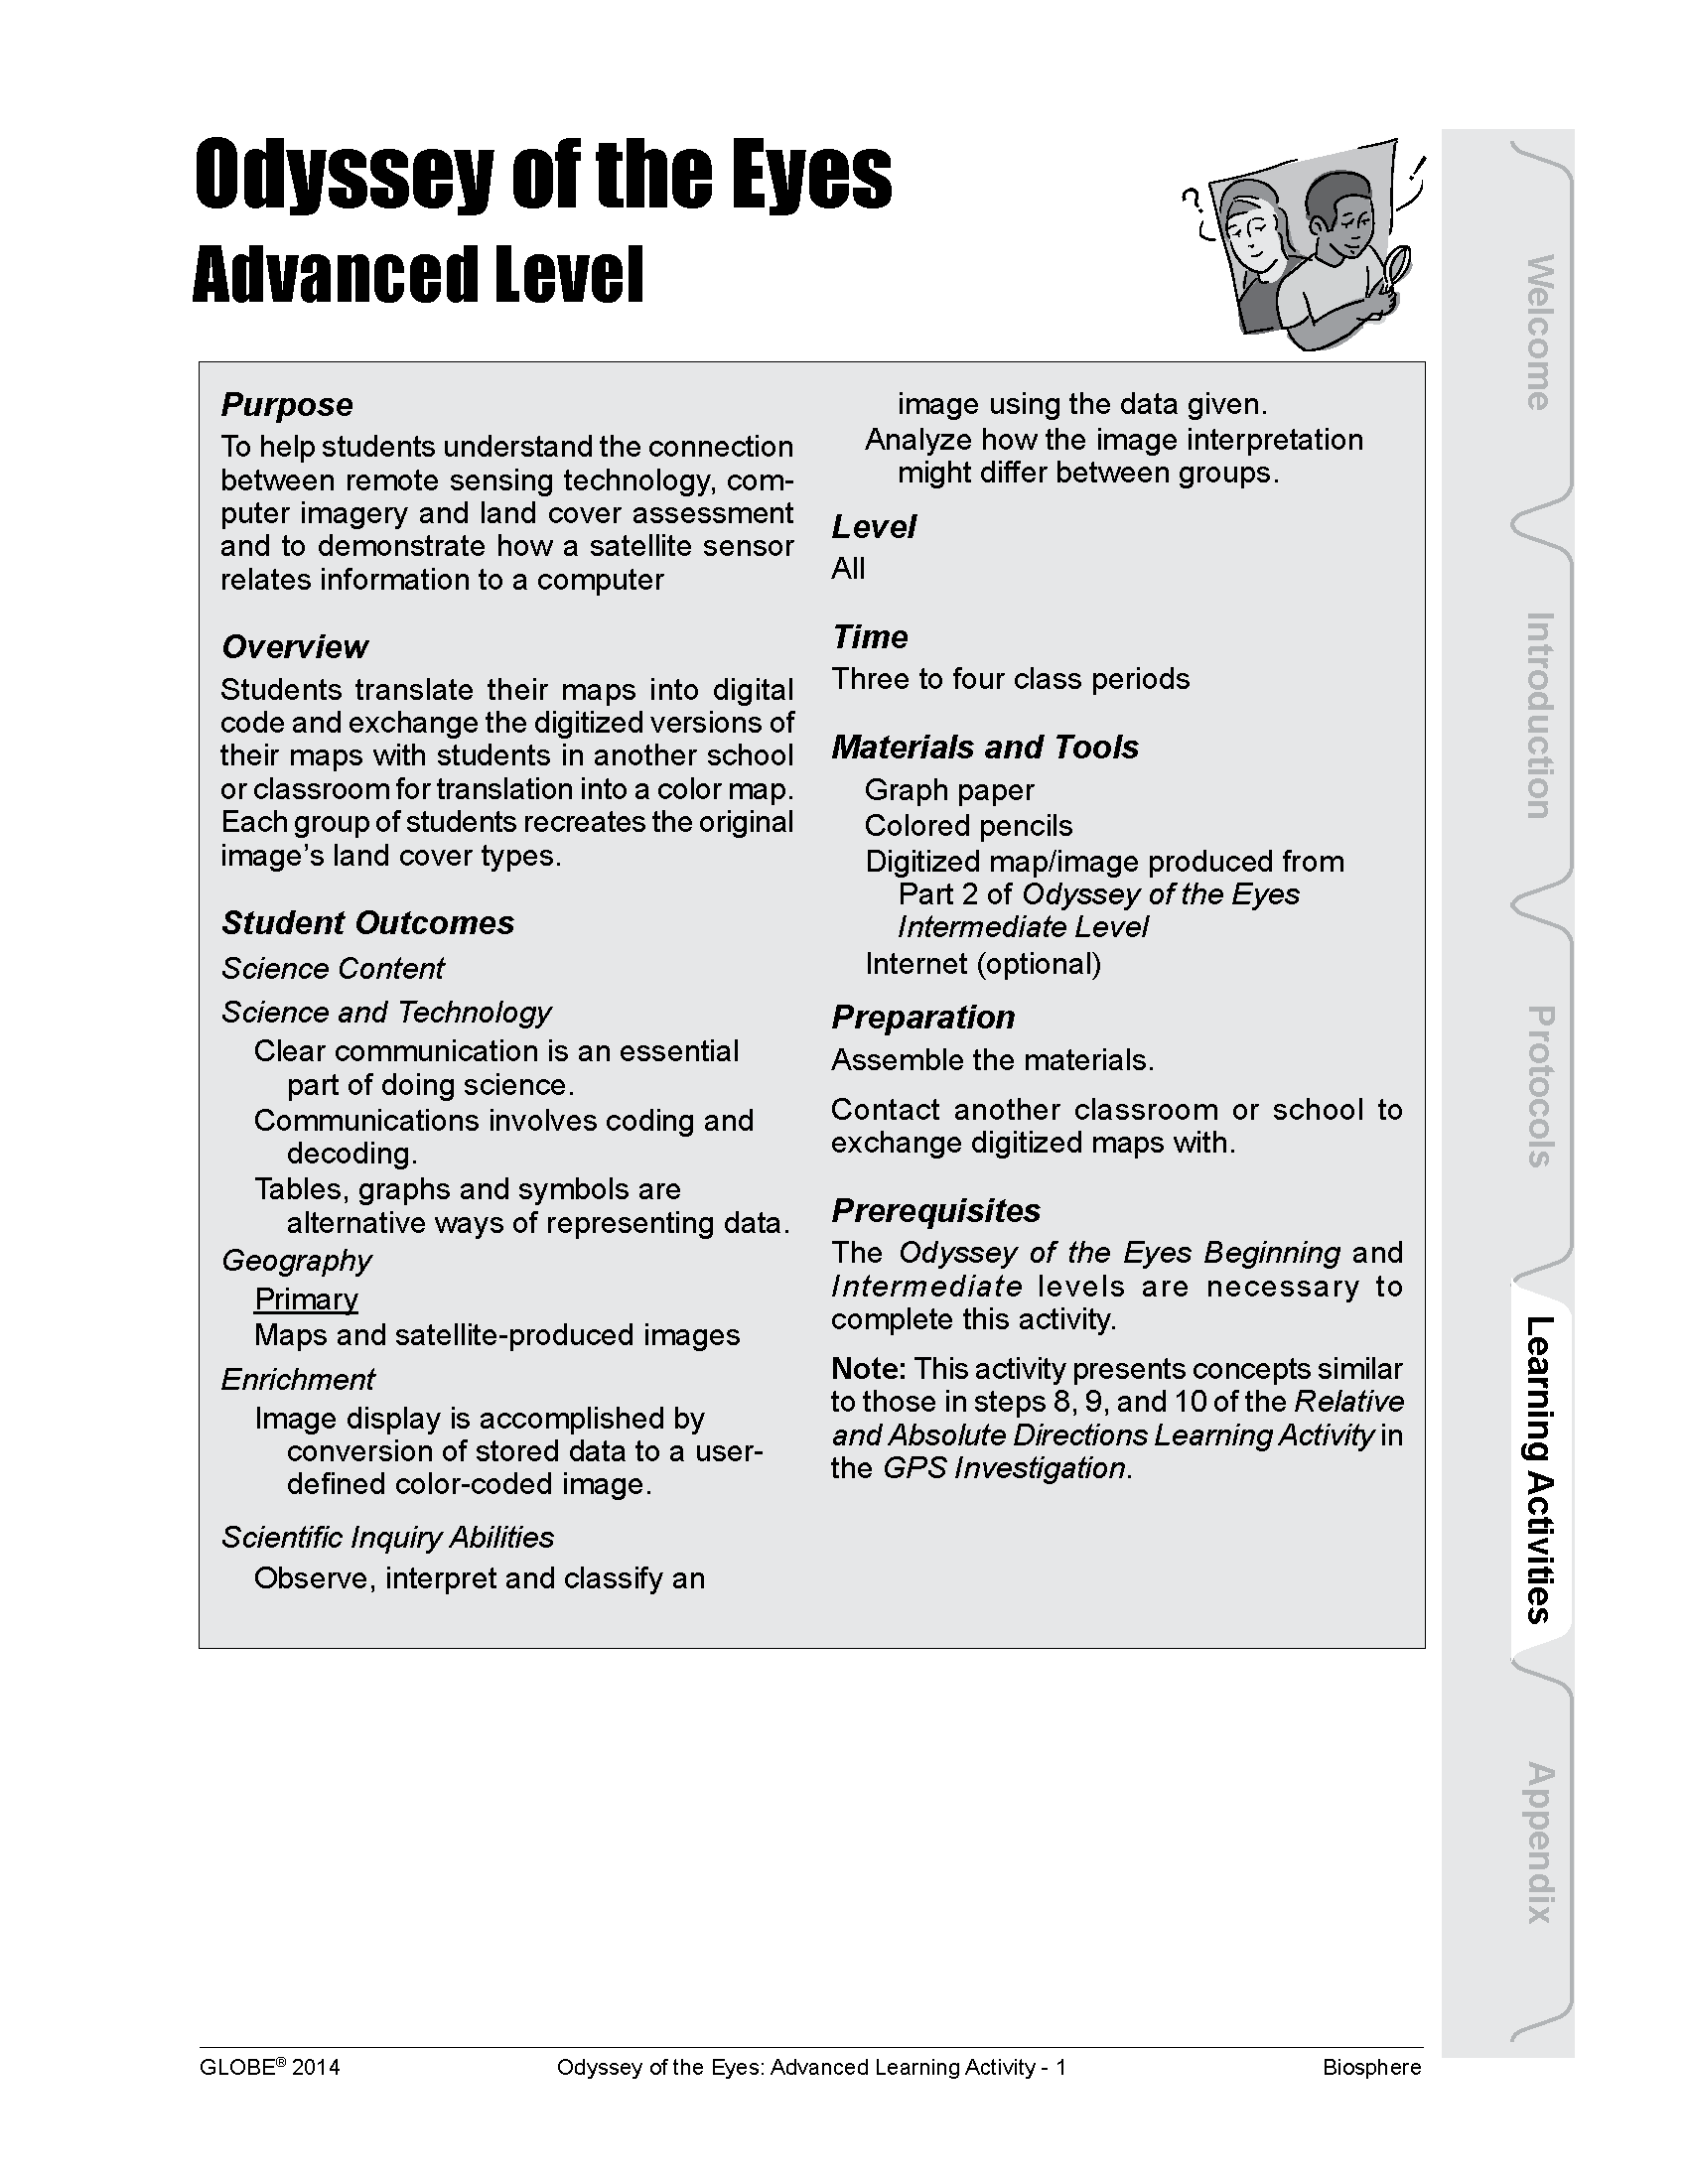
Overview: Students investigate the connection between remote-sensing technology, computer imagery, and land cover assessment as well as demonstrate how a satellite sensor relates information to a computer.
GLOBE Observer Land Cover
Image Credit: NASA
Student Outcomes:
- Clear communication is an essential part of doing science
- Communications involve coding and decoding
- Tables, graphs, and symbols are alternative ways of representing data
- Maps and satellite-produced images
- Observe, interpret and classify an image using the data given
- Analyze how the image interpretation might differ between groups

Sphere(s)
- Earth as a System