Mini Lesson/Activity
Interpreting Earth's Energy Budget
Overview
This mini lesson focuses on Earth's Energy Budget and the surface effects that occur in Central Australia. Students review a line graph depicting net radiation in Central Australia related to a multiyear drought from 2002 - 2009 and answer the questions.
Student Directions
Surface Effects on Energy Budget - Changes in Central Australia.
While the energy budget averaged over the globe changes little from year-to-year, large changes can occur due to changes in the Earth’s surface or atmosphere on a local or regional basis. For example, the graph below shows the change in net radiation over a region of Central Australia. Net radiation is measured in watts per square meter (W/m2). When more energy is coming in than going out, net radiation is positive. When more energy is going out than coming in, net radiation is negative. When the amount of energy going out is the same as coming in, the net radiation is zero and considered balanced (dashed line).
The area of Central Australia experienced a multiyear drought from 2002-2009, during which time the region went from being a net absorber to a net emitter of energy, largely due to a change from plant-covered ground and dry soil. Heavy rainfall in 2010 broke the drought, resulting in a large increase in vegetation and soil moisture and a return to net absorption of energy. Similar changes occur on a smaller scale whenever human activities change the surface of the Earth.
Analyze the line graph below and answer the following questions.

Steps
- Check with your instructor on how to submit your answers.
- Compare the solid line with the dashed line. What year is the highest increase in positive net radiation? What year is the highest decrease in negative net radiation?
- Describe how the Net Radiation at the surface in Central Australia vary from 2000 to 2012.
- Identify which years in Central Australia experienced drought. Does this indicate that the area is a net absorber of energy or a net emitter of energy?
- What do you think happened in the region in 2010?
Sources:
-
What is Earth's Energy Budget? Five Questions with a Guy Who Knows. (n.d.). NASA. Retrieved August 10, 2022, from https://www.nasa.gov/feature/langley/what-is-earth-s-energy-budget-five-questions-with-a-guy-who-knows
Teacher Note
Teachers, these mini lessons/student activities are perfect "warm up" tasks that can be used as a hook, bell ringer, exit slip, etc. They take less than a class period to complete. Learn more on the "My NASA Data What are Mini Lessons?" page.
Teachers who are interested in receiving the answer key, please complete the Teacher Key Request and Verification Form. We verify that requestors are teachers prior to sending access to the answer keys as we’ve had many students try to pass as teachers to gain access.
Background:
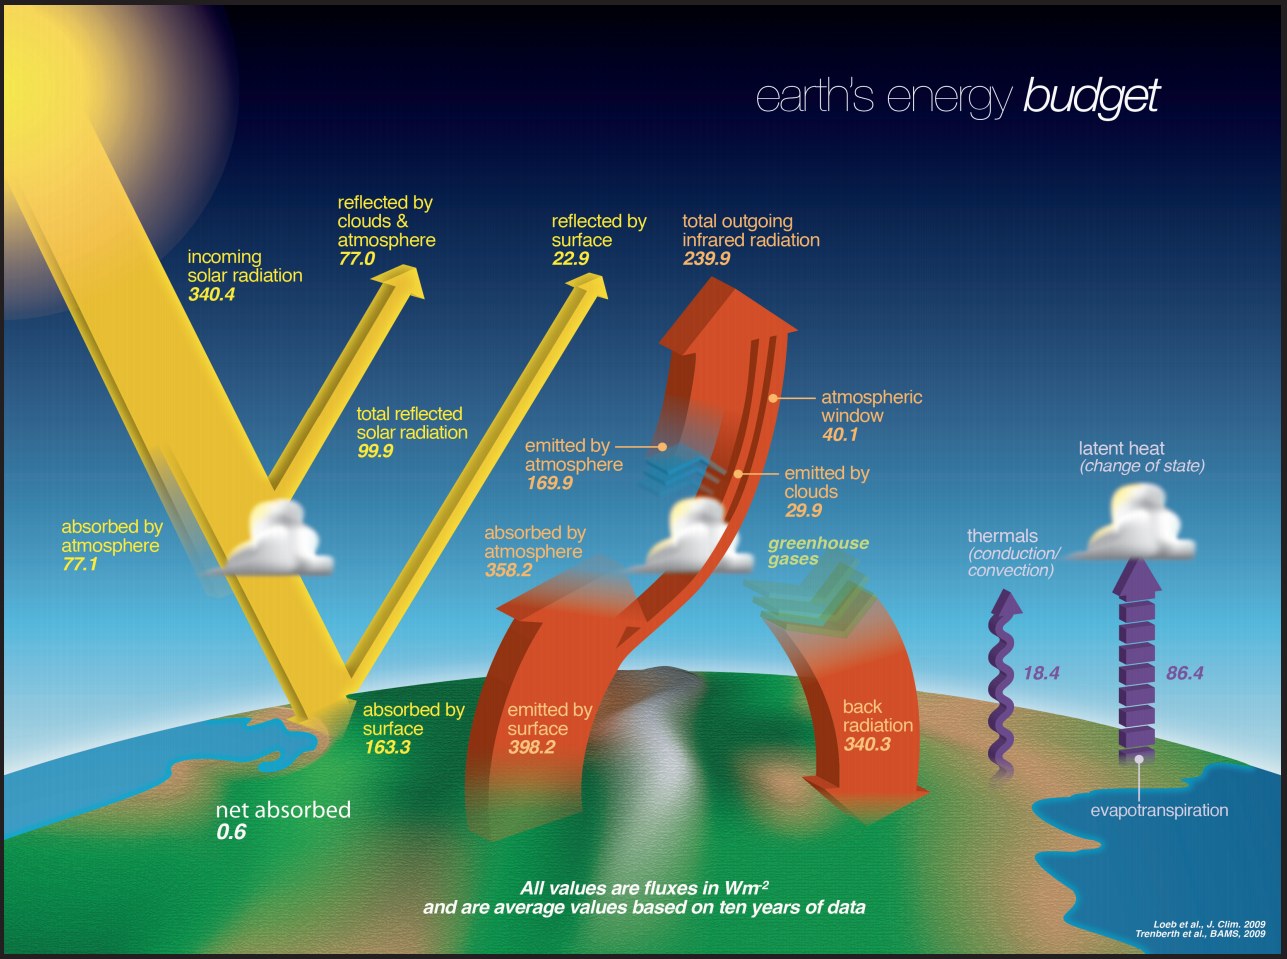
The energy budget diagram on the front shows our best understanding of energy flows into and away from the Earth. It is based on the work of many scientists over more than 100 years, with the most recent measurements from the Clouds and the Earth’s Radiant Energy System (CERES; http://ceres.larc.nasa.gov) satellite instrument providing high accuracy data of the radiation components (reflected solar and emitted infrared radiation fluxes). This energy balance determines the climate of the Earth. Our understanding of these energy flows will continue to evolve as scientists obtain a longer and longer record using new and better instruments.
Supported NGSS Performance Expectations

Document Resources
Grade Band
- 6-8
- 9-12
Time
- 15 minutes